InterAction Flow Mapping
Because We Need One More Collaborative Modeling Tool
Why Another Model?
Yes, there already exist plenty of modeling notations and workshop formats that have proven their value in many contexts (check out the book Visual Collaboration Tools for an overview). This article is not an argument against any of these tools.
Still, despite being a great source of inspiration, somehow none of these methods felt exactly right for what I was trying to accomplish when creating the diagrams for my latest book. So, just in case I’m not the only one out there yearning for an alternative approach, I wanted to share my notation and the ideas behind it in more detail.
Modeling from Different Perspectives
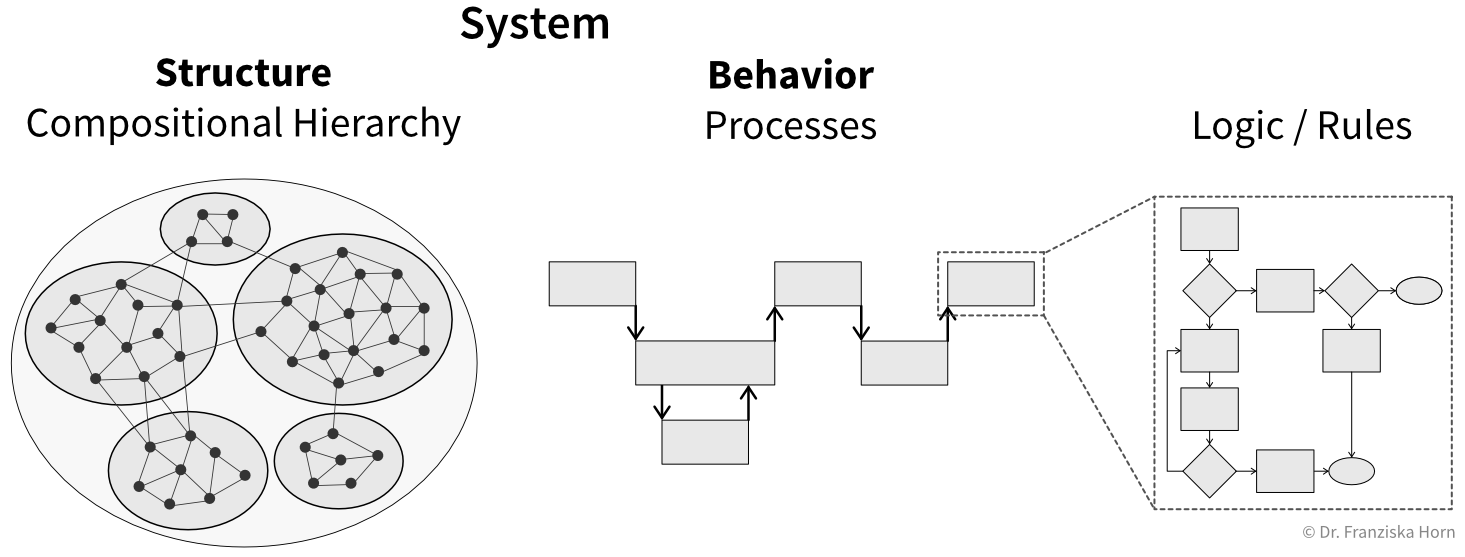
Let’s start by acknowledging that systems can be modeled from different perspectives (Figure 1).
One perspective focuses on a system’s structure: how individual elements are organized and composed into larger subsystems (often forming bottom-up in natural systems). Examples include:
- Cells → Organs → Human body
- Employees → Teams → Departments → Company
- Lines of code → Functions and classes → Modules (files and folders) → Repository or deployable service
Tools such as Context Mapping and the C4 Model help describe the structural perspective of (software) systems.
Another perspective focuses on behavior: what the system does over time. Examples include:
- Digesting food
- Onboarding a new employee
- A user interacting with a mobile app to accomplish a task
These behaviors can be described as processes, which are the focus of this article.
Processes themselves can be examined at different levels of granularity. Here, we deliberately stay at a higher level of abstraction.
Techniques such as Example Mapping are better suited for zooming in further and uncovering the detailed business rules that govern individual steps.
Process Modeling
Existing tools to model processes all optimize for slightly different goals, for example:
- UML and BPMN are well-established standards for modeling software behavior and business processes. They allow for very detailed and precise diagrams, but their specialized notation often makes the resulting models difficult to grasp for non-experts. They were also primarily intended for documentation rather than collaborative exploration.
- EventStorming is a popular collaborative modeling technique that emphasizes accessibility by using plain-language domain events. It works particularly well for discovering domain concepts and behavior, especially in unfamiliar problem spaces. However, the initial chaotic exploration phase can quickly become visually overwhelming, and as more structure and technical details are added, the resulting model often becomes difficult to follow. Additionally, expressing events in the past tense is unintuitive for many participants.
- Domain Storytelling focuses on interactions between actors and objects and produces diagrams that are easy to understand and discuss. While effective for creating a shared overview, the temporal sequence of a process is represented indirectly through numbered arrows, which can make it harder to perceive the overall flow at a glance in more complex scenarios.
InterAction Flow Mapping is not supposed to replace these approaches. Instead, it fills a specific gap by combining the simplicity of Domain Storytelling with the precision of UML:
- A simple diagram that is easy to understand, even for non-technical domain experts.
- A clear view of the process over time, with explicit separation of the different actors involved.
- A notation that supports direct translation of the modeled process into a software implementation.
The technique that comes closest to InterAction Flow Mapping is Event Modeling. It visualizes wireframes alongside read and write operations that aggregate event-based data from multiple sources. The resulting diagrams are easy for domain experts to follow while still providing a rough implementation blueprint for developers. In practice, however, I found these models map more naturally to event sourcing architectures and often require an extra translation step when implementing a process with a simpler CRUD-based design.
The InterAction Flow Notation
An InterAction Flow models a process as a sequence of interactions between actors. It can be used to visualize both analog processes as well as software behavior.
The modeling canvas is simple:
- The horizontal axis represents time.
- The vertical axis represents actors in swimlanes—typically starting with a user or customer at the top (who initiates the process), followed by software modules or organizational units, and ending with data stores or records at the bottom.
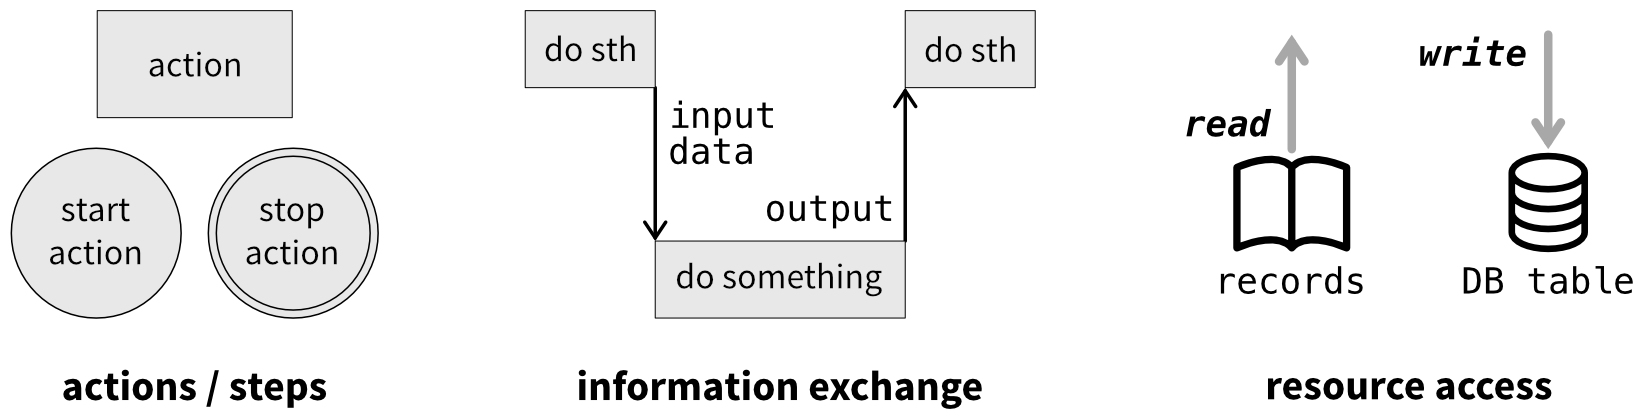
The visual elements are intentionally minimal (Figure 2):
- Action boxes describe what an actor does, labeled with a short phrase in present tense starting with a verb (e.g., verify credentials). These actions should be meaningful at the business level and plausibly map to a function, API endpoint, or responsibility in software.
Start and end markers indicate where the process begins and terminates. These borrow from BPMN but are optional—feel free to use normal stickies in a CoMo session. - Arrows connect actions across swimlanes and are labeled with the information being exchanged. In software terms, these often correspond to input parameters and return values.
- Resource icons indicate where data is read or written during an action.1
InterAction Flows in Action
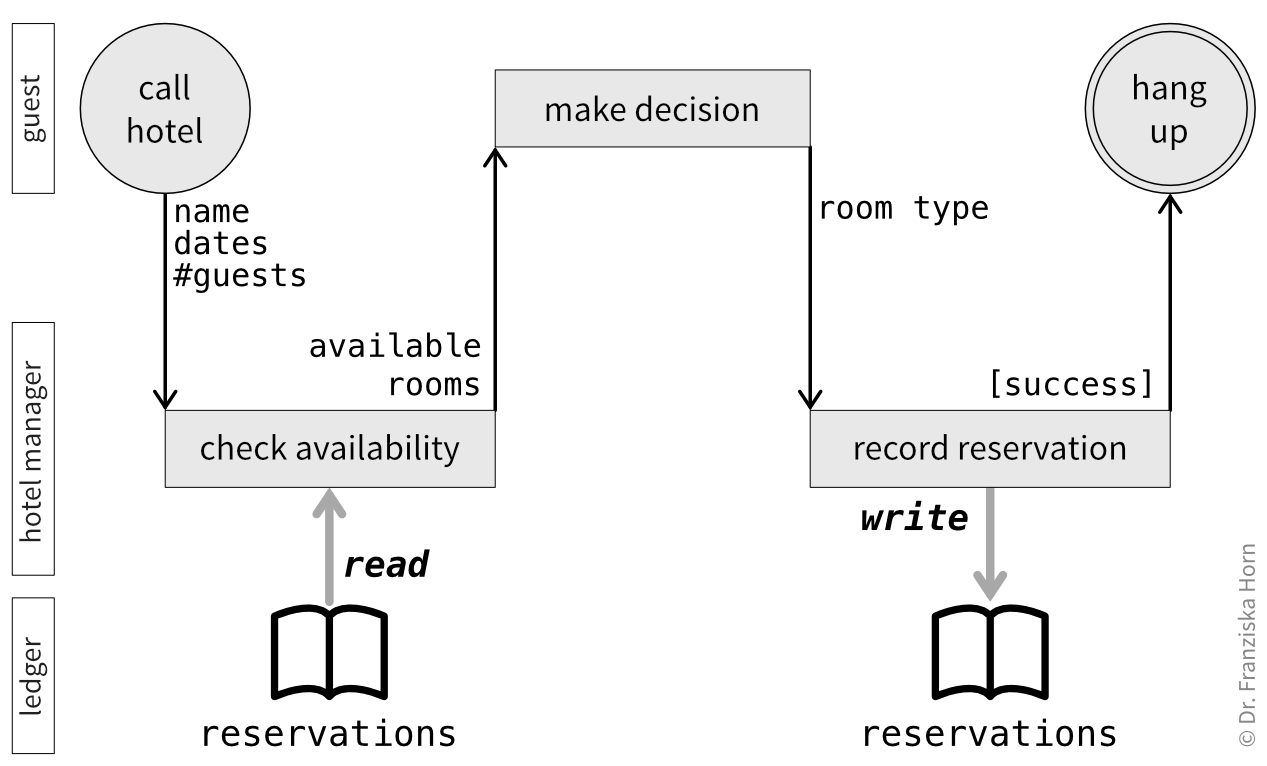
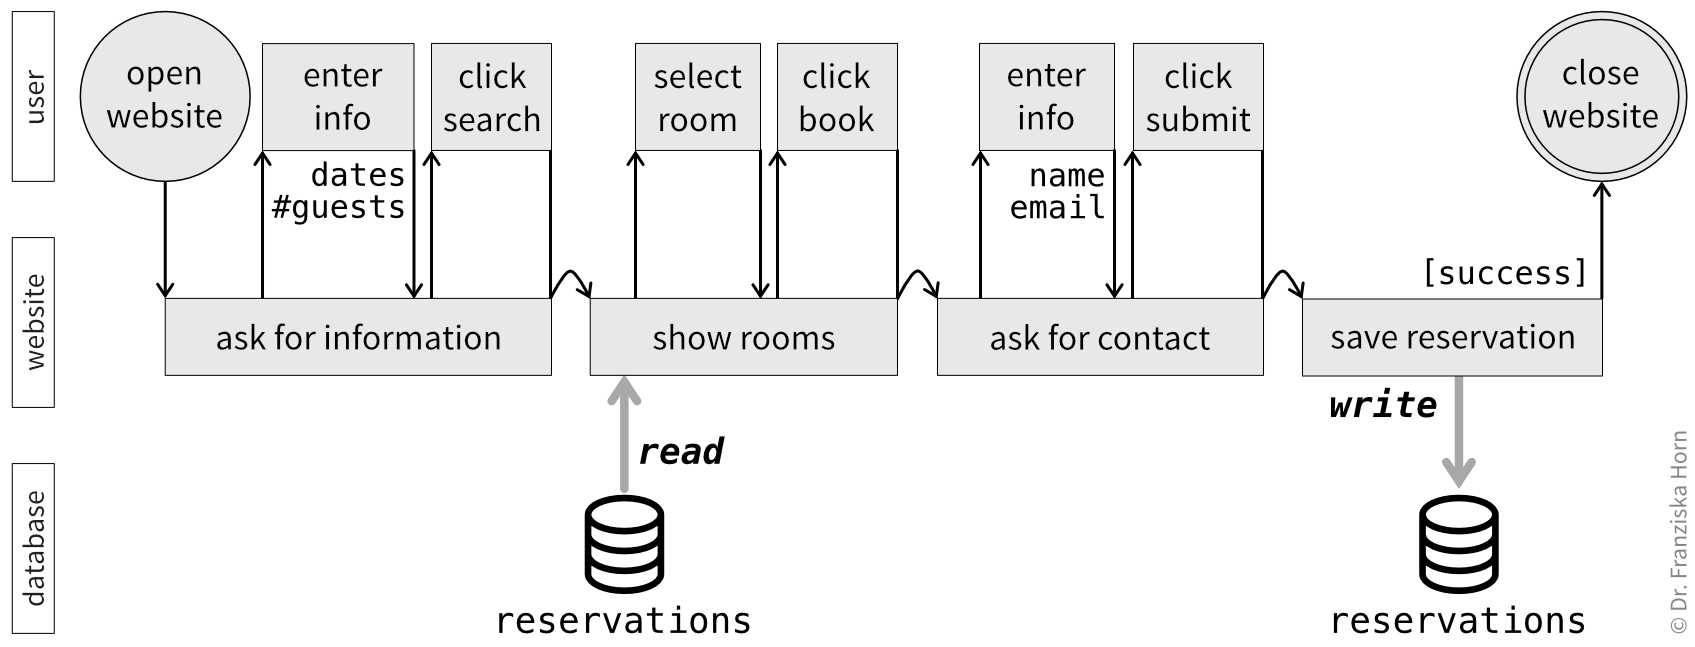
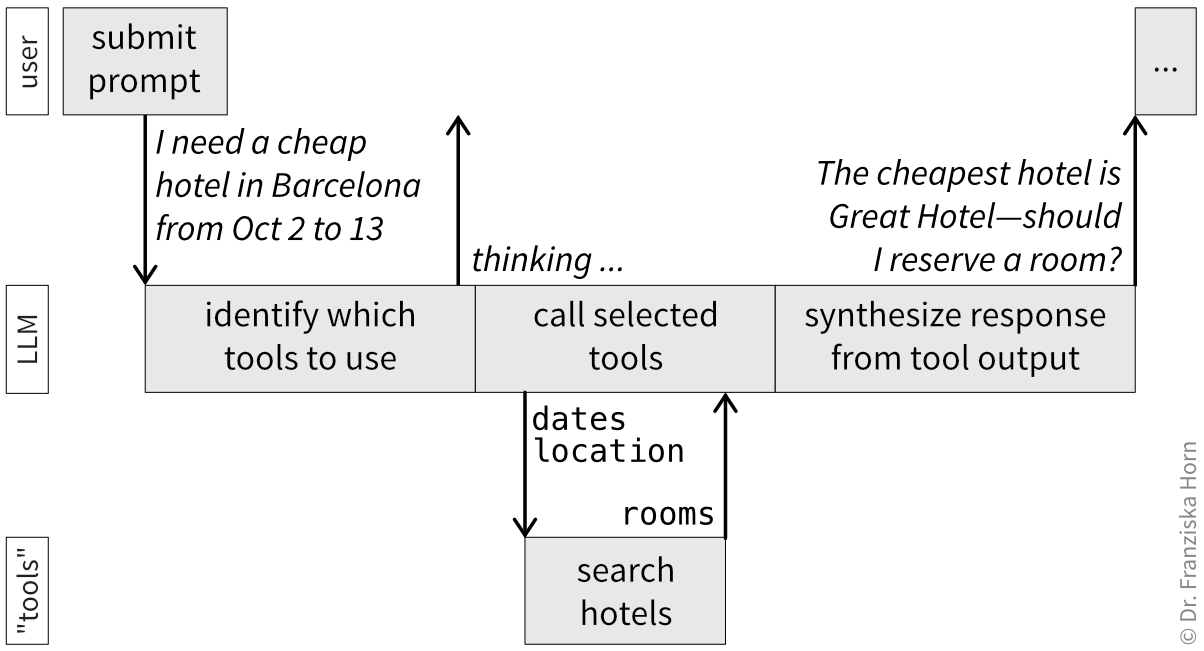
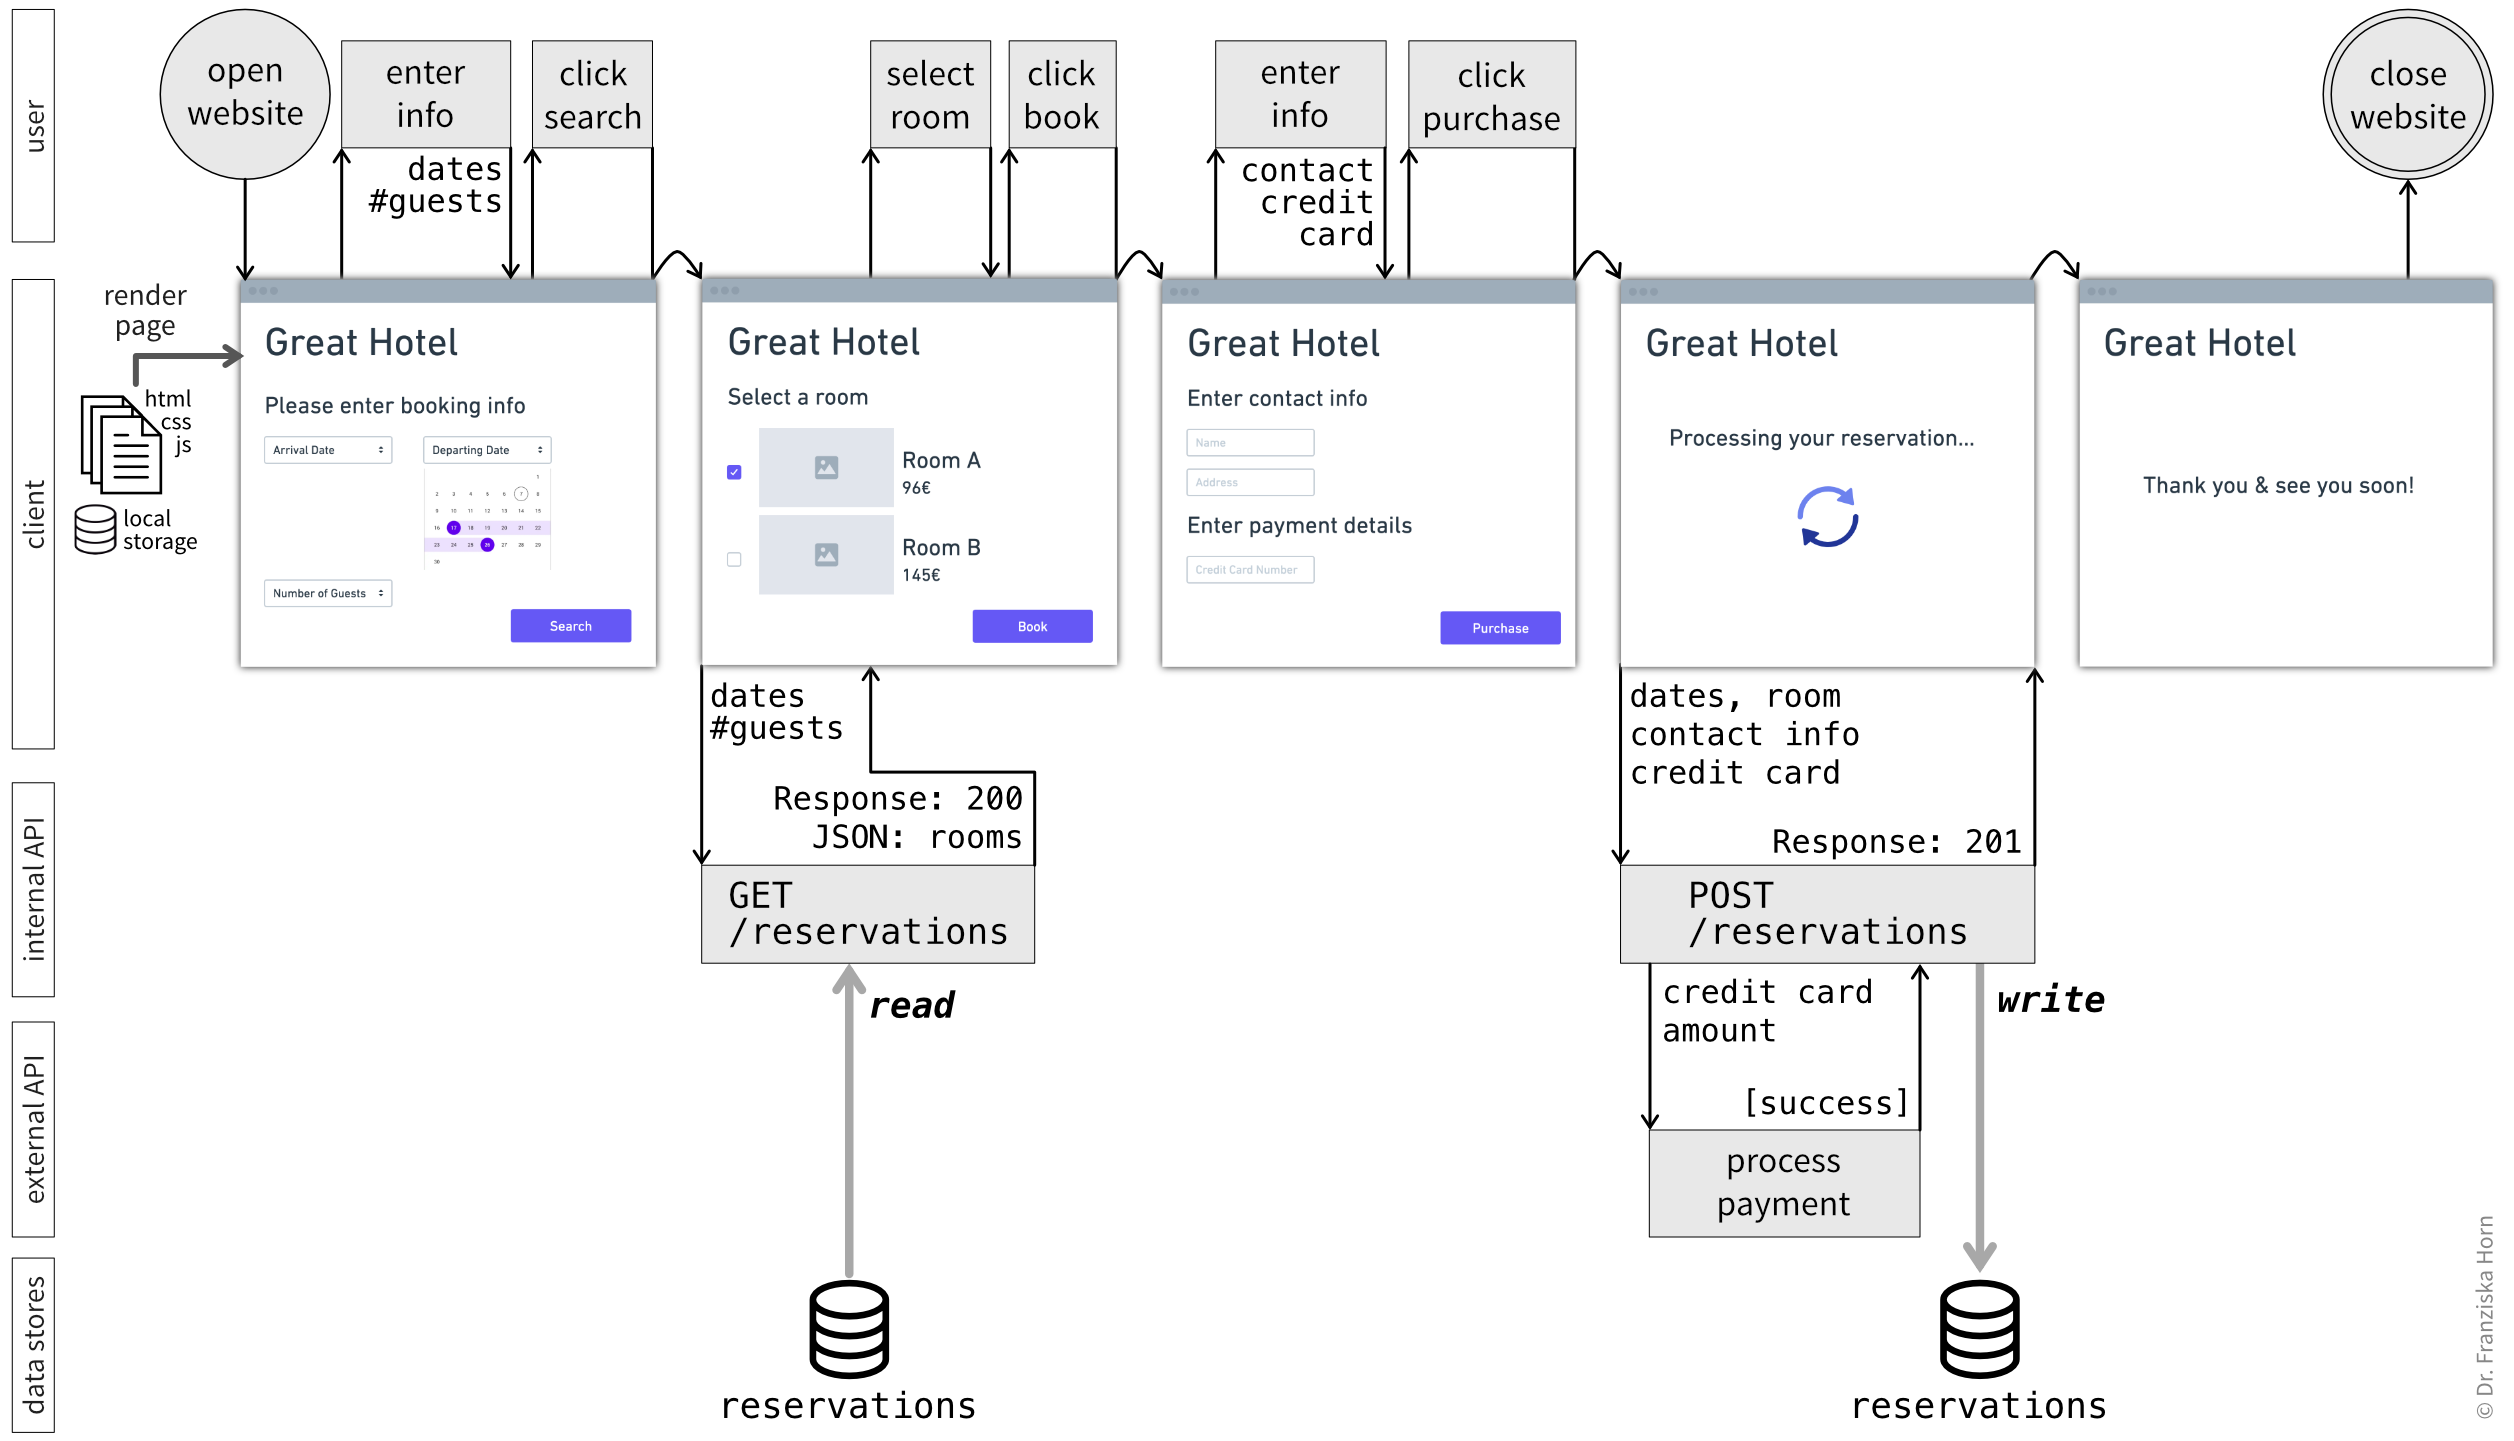
A simple example of an analog process—reserving a hotel room by phone—modeled as an InterAction Flow is shown in Figure 3, while the corresponding software-enabled process is shown in Figure 4.
It is also possible to model multiple subactions in sequence for a single actor when a particular step is especially complex and decomposing it adds clarity (Figure 5).
If your process is not triggered by an external event but rather runs on a schedule, simply put the corresponding time in the circle denoting the start of the process.
If you feel compelled to add conditionals or loops to your flow, this is often a signal to pause and reconsider the level of abstraction. A lot of branching behavior happens inside an action and does not need to be visible at the overview level.
When branching paths are central to the discussion, start by modeling the happy path and add annotations where alternatives exist, or create a separate diagram that starts at the branching point to explore the alternative flow. In some cases, it is also possible to describe different paths using separate swimlanes (Figure 6).
From Diagram to Code
InterAction Flows translate naturally into software design:
- Action boxes often map directly to function calls or API endpoints.
- Arrow labels make the required data contracts explicit.
- Swimlanes highlight ownership and boundaries between systems or teams.
- Resource icons encourage early discussion about persistence and data ownership.
When co-creating an InterAction Flow in a collaborative InterAction Flow Mapping session, it often makes sense to keep the diagram more abstract, as shown in the previous figures. That said, if you want to use an InterAction Flow as a blueprint for implementation, you can easily include additional technical details and wireframes to make the intended software behavior more explicit (Figure 7).
InterAction Flow Mapping Workshops
I propose two formats for InterAction Flow Mapping workshops, tailored to two common goals:
- designing a new (to-be) process, or
- improving an existing (as-is) process.
Both workshops can be run in-person or remotely2. Feel free to adapt these workshop formats to your needs!
For more tips on how to conduct successful collaborative modeling sessions, please refer to the excellent book Collaborative Software Design.
Designing a New (To-Be) Process
This workshop format emphasizes shared design and exploration, like a typical CoMo session.
Preparation
Prepare the space and ensure participants know which process will be designed.
Running the Workshop
Depending on how complex the process is, this workshop might take a full day or you can split it over multiple sessions.
Main workshop steps:
- Introduce goal and notation: Clarify (again) which process will be modeled and briefly explain the InterAction Flow elements if participants are unfamiliar with them.
- Braindrawing (together, alone): Give participants 5–10 minutes to independently sketch the process from their perspective, focusing on actors and their actions.
- For in-person sessions, provide paper and pencils; for remote sessions, prepare an individual whiteboard frame with example elements for each participant.
- A useful approach is to start with user interactions and then move on to refining the required data, its sources, and persistence.
- When redesigning an existing process, participants should try to ignore current constraints and design an ideal target process from scratch.
- Gallery walk: Allow time for participants to review each other’s diagrams.
- Select a starting point: Choose one diagram as the basis for the shared InterAction Flow—preferably via dot voting during the gallery walk, or by facilitator choice if time is limited.
- Incremental refinement: Starting with the author of the selected diagram, participants take turns explaining their view while the group incrementally refines the shared InterAction Flow based on the new perspective.
- [Optional] Compare with the as-is process: When redesigning an existing process, compare the new flow with the current-state diagram (including any identified pain points) to ensure no key steps are missing and major issues are addressed.
For software-based processes, proceed by defining a refactoring plan with iterative improvements that gradually move the current process toward the target state, rather than attempting to implement a new flow from scratch while maintaining the existing one in parallel until a full replacement is possible.
For software projects, the InterAction Flow can be refined further to aid the implementation (as in Figure 7) by splitting into two groups:
- Group 1 (incl. a UX Designer / Product Owner, Frontend Developer): Refines user interactions, adds wireframes, and identifies data needed to render the UI.
- Group 2 (incl. a Backend Developer): Refines API and data store layers, including database schemas or ORMs.
This can be done in breakout sessions or asynchronously. The groups then reconvene to align their results and ensure the overall flow remains consistent and data needs are met end to end. At this point it can also be helpful to perform a Data Completeness Check.
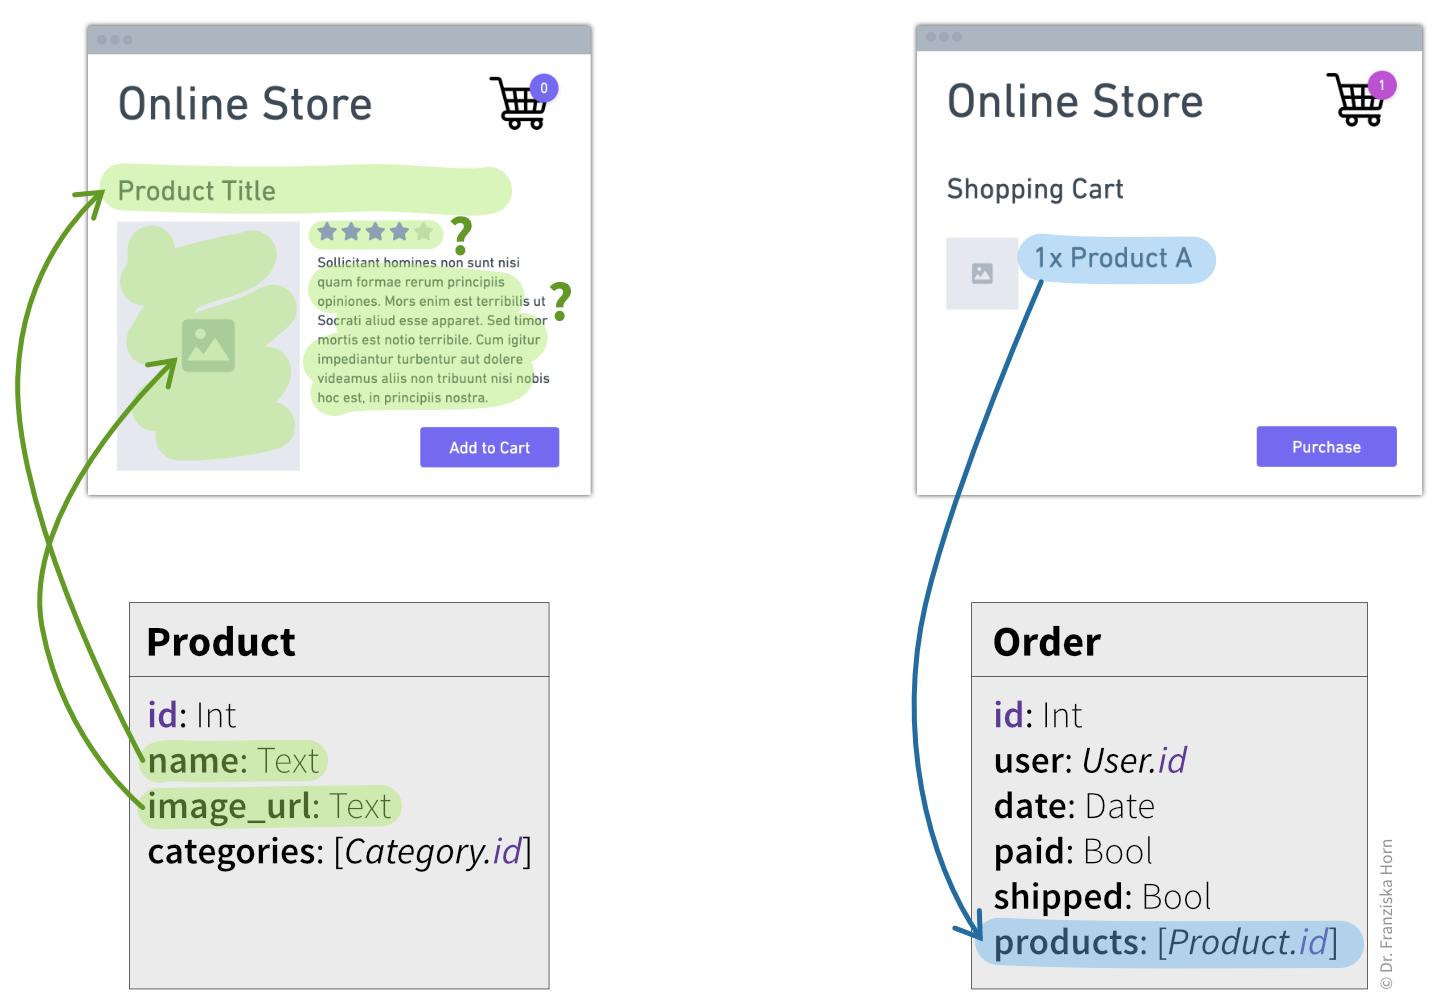
An interesting concept in Event Modeling is the Data Completeness Check: Each dynamic element in a wireframe is highlighted in a specific color to indicate whether the data shown there needs to be retrieved from (green) or persisted in (blue) a data store. By then linking these elements to our database schema, we can check whether we are storing all data required to enable the user experience we want (Figure 8).
Improving an Existing (As-Is) Process
This workshop is ideal for analyzing and improving an existing process, surfacing problems, and identifying solutions. It draws inspiration from the book Flow Engineering.
Preparation
Since here the focus is on identifying problems rather than creating a new process, preparing the InterAction Flow is less of a creative exercise and can often be done in advance. Talk to key stakeholders to get different perspectives and draft a diagram that can serve as a conversation starter in the workshop. Consider sharing the diagram with participants in the invitation so they can review it beforehand.
Running the Workshop
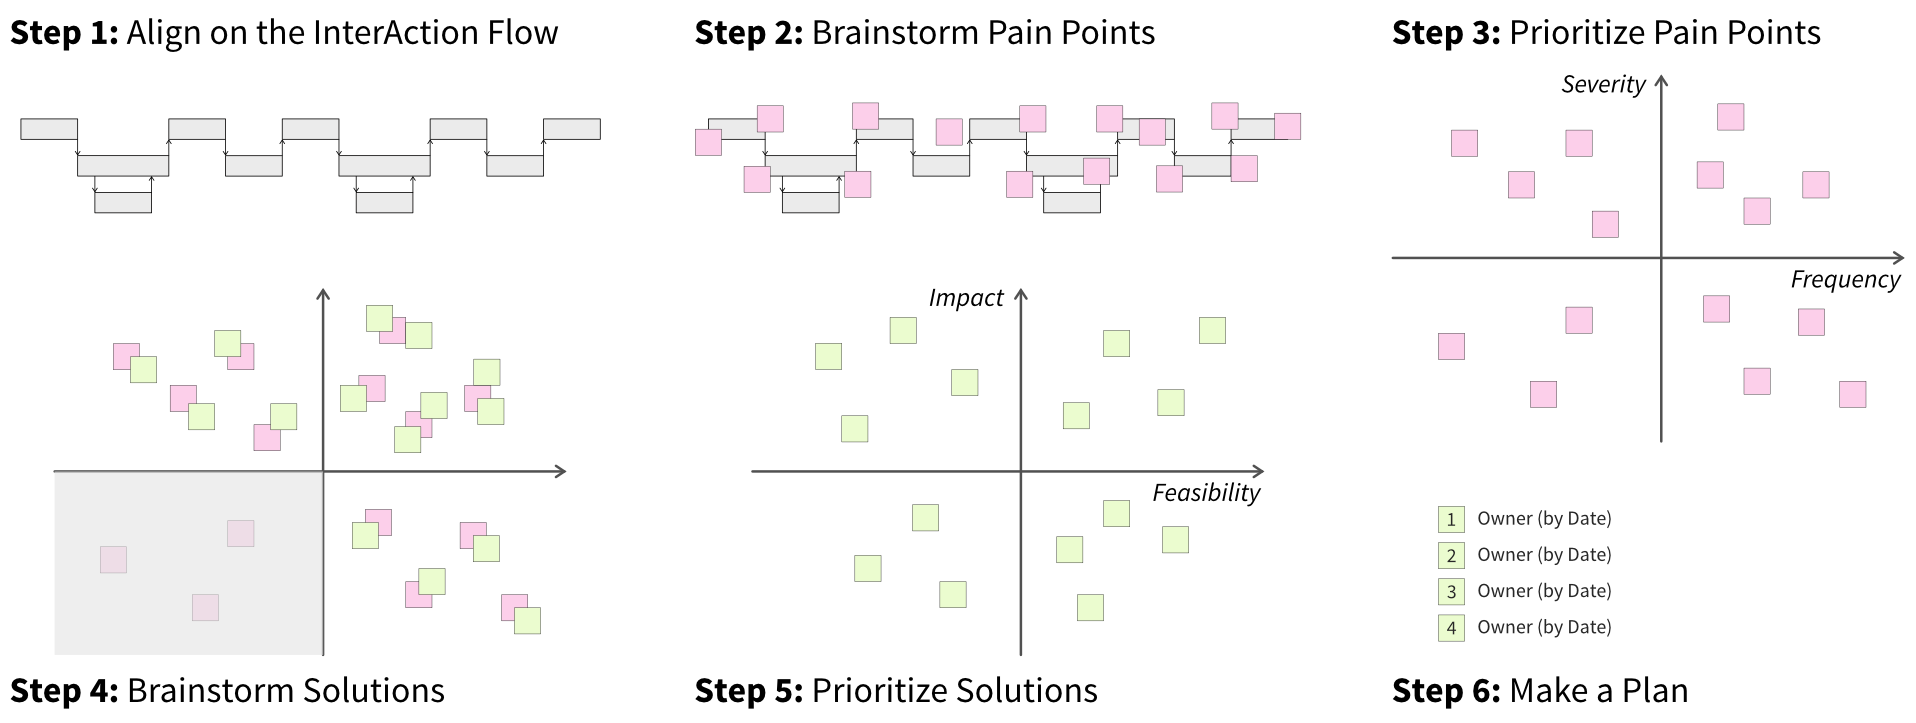
Plan for 1–3 hours depending on process complexity. The workshop typically follows six steps (Figure 9):
- Align on the InterAction Flow: Walk participants through the diagram and refine it collaboratively.
- Brainstorm pain points: Participants add pink stickies for any problem they notice, from minor UI issues to tedious manual steps.
- Prioritize pain points: Rank the pink stickies by dimensions relevant to your context, like severity (“how annoying is this?”) and frequency (“how often does it happen?”).
- Brainstorm solutions: Participants suggest solutions for the prioritized pain points, adding green stickies to corresponding problems.
- Prioritize solutions: Rank solution ideas by impact (“by how much could this improve the overall situation?”) and feasibility (“how easy would it be to implement?”).
- Make a plan: Use dot voting to select 3–5 solutions to implement, assign owners and deadlines, and track progress in the team’s project management tool.
Follow up on assigned tasks and revisit the board for further improvement ideas as needed.
Footnotes
One reason for modeling these resources separately is to make it easier to distinguish between pure and impure functions in a software flow.↩︎
In terms of digital whiteboarding tools, I recommend using Miro (or their WebWhiteboard to get started without an account) or Excalidraw.↩︎