2 Outcome: Why?
Before writing your first line of code, it’s crucial to clearly understand why your idea is worth implementing—specifically, the desired outcome of your research. This helps you focus on developing an innovative solution that creates real value by improving existing approaches or addressing unmet needs. Furthermore, this clarity will enable you to communicate your research more effectively to ensure your audience understands the benefits of your work.
Why We Develop Software
While programming can be enjoyable in its own right, most people—and especially companies—aren’t willing to invest significant time or resources unless there’s a clear return. So why do we implement anything anyways?
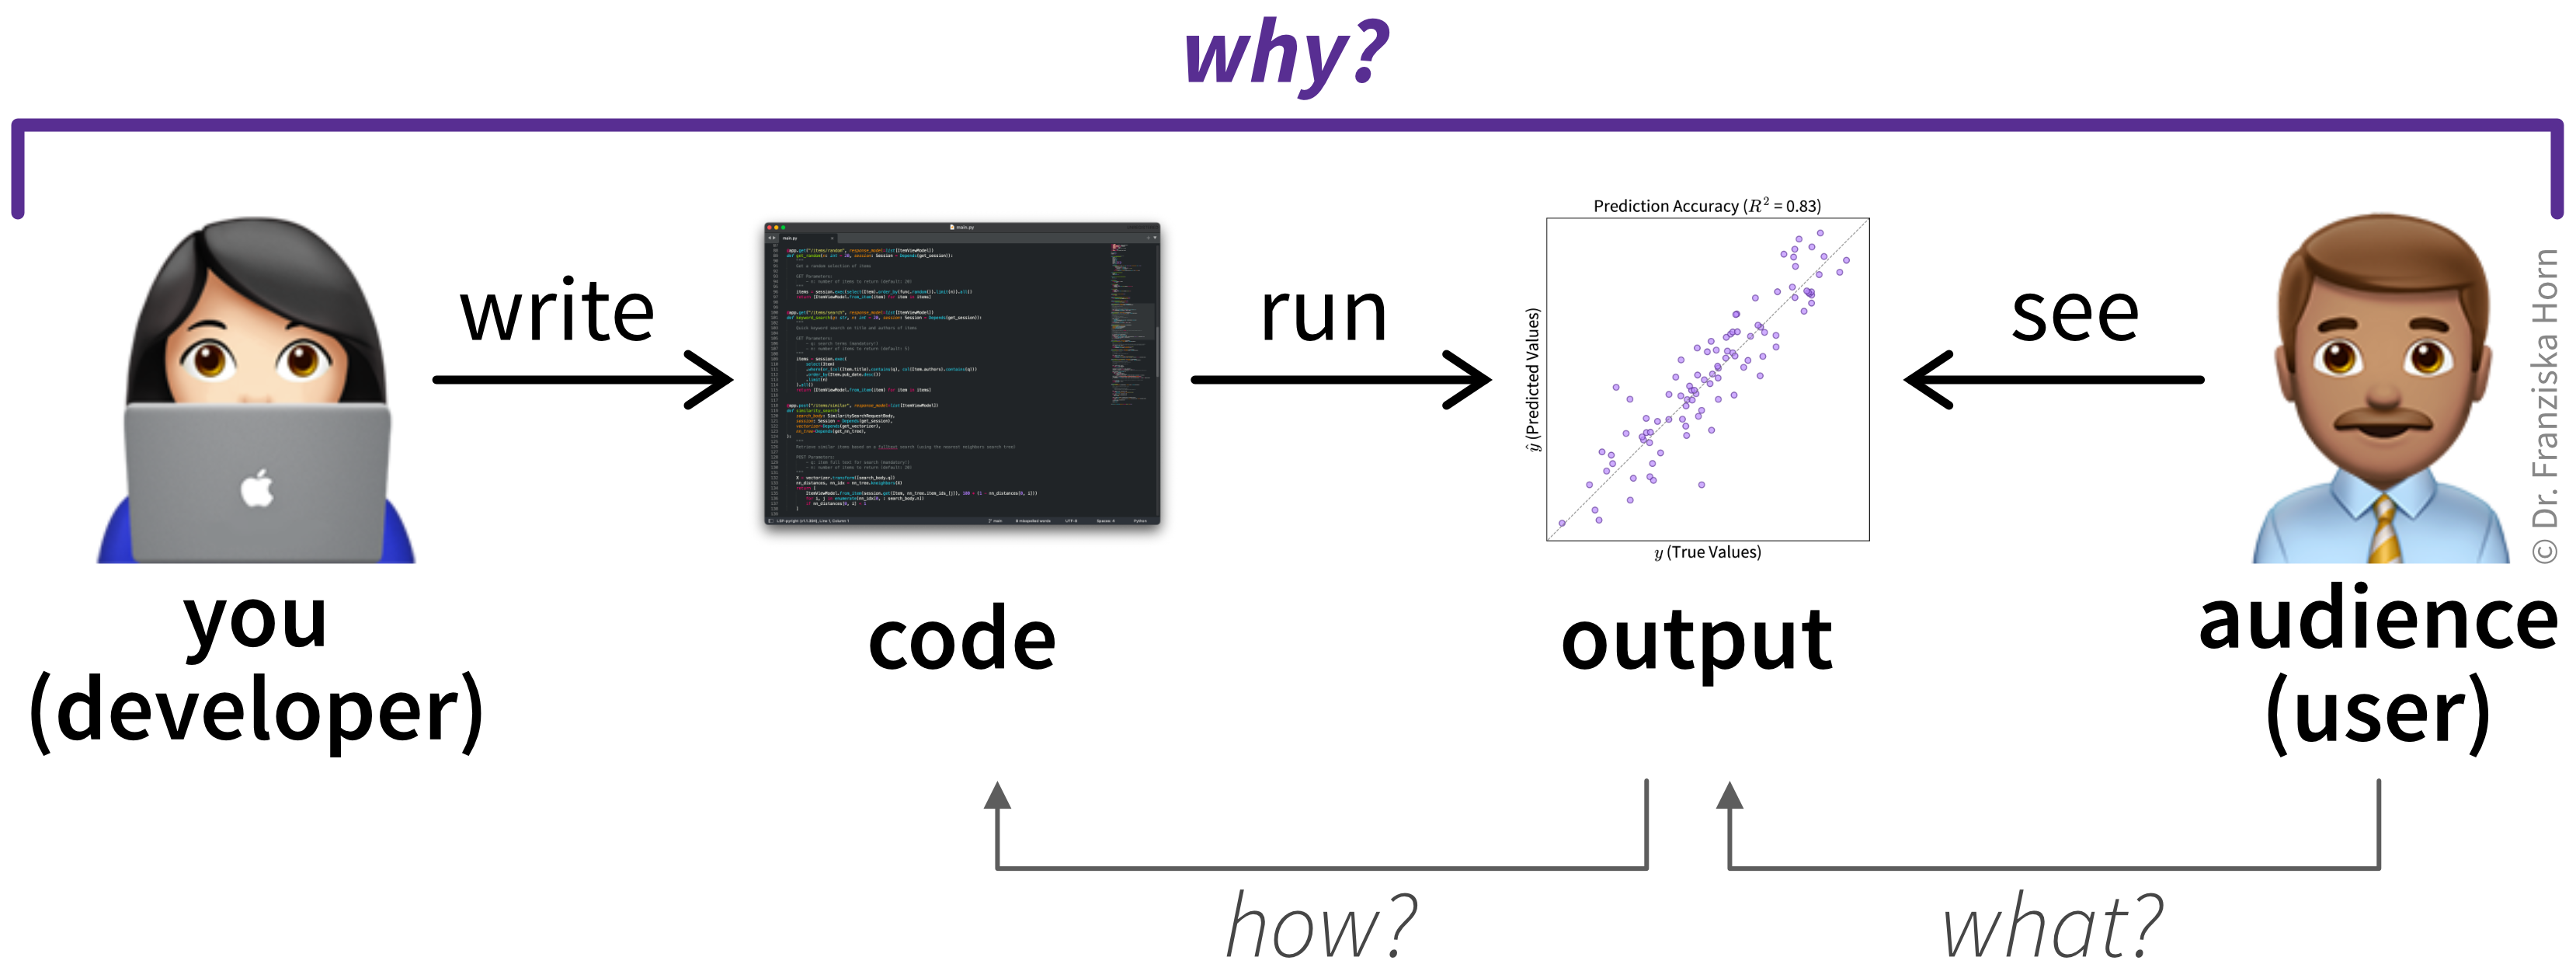
Please note that there is a difference between code and a software product:
- Code is simply text written in a programming language (like Python).
- A software product is code that actually runs—either locally (on your laptop or phone) or remotely (as a web service in the cloud)—and produces an output that users interact with.
Sometimes that interaction with the program is the end goal (e.g., when playing a video game). Other times, the software is just a means to an end—like a website you use to order clothes online or the script you run to generate your research results (Figure 2.1).
When it comes to serious software development, achieving profit and/or recognition can be a strong motivator.
A company looking to make a profit can do so in one of two ways:
Increase revenue: The company builds a software product that users are willing to pay for, like a web application offered as software-as-a-service (SaaS) with a monthly subscription, or a feature that results in customers spending more money, like better recommendations on an e-commerce platform.
Reduce costs: Alternatively, the company might build internal tools that automate tedious or repetitive tasks. By saving employee time, these tools reduce operational costs and indirectly increase profit.
As an individual—especially in research—your primary goal is probably to get some recognition in your field. For instance:
- You might write code to generate results that get your paper published in a respected journal and cited by others.
- Or you might create an open-source library that becomes popular (and receives a lot of stars on GitHub).
With a bit of luck, that recognition could also translate into profit, as a successful side project might lead to a lucrative job offer or form the basis for a new grant proposal.
Beyond realizing more immediate benefits like profit or recognition, investing in software development is also a strategic decision. Companies often choose projects that strengthen their market position, build long-term capabilities, or differentiate them from competitors. Similarly, as an individual, you should consider whether working on a given software project advances your broader career goals and helps you acquire valuable new skills.
Whatever the motivation, our software will only make an impact if it addresses a real need. Ultimately, it must create value for our users by offering a better solution than the alternatives they have available today.
Commercial Software Outcome: Satisfied Users
To create value for the users of a commercial software application, we must first develop a good understanding of our target users and their priorities to determine what they would consider a “better solution” than the alternatives available to them right now [1]. This actually applies not just to software, but to all products—physical or digital—like a woodworking tool or an e-commerce website.
Ask yourself:
Who are your users?
Depending on the product, your target user group might be broad or highly specific. For example, a normal consumer product could be used by anyone over 14, while enterprise solutions may cater to niche audiences, such as professionals in a particular field. Even if your users could theoretically be “everyone,” picturing a more specific user can help refine your solution. Trying to please everyone often results in satisfying no one. Focusing on a distinct user group can also help differentiate your product in the market.User experience (UX) designers often create user personas—fictional but representative users based on real-world insights. These personas include details like age, profession, hobbies, and specific needs:
- Woodworking tool: “Mary, the multitasking mom”—a part-time teacher who enjoys DIY projects and wants to build a bird house with her daughter.
- E-commerce website: “Harry, the practical shopper”—a 55-year-old lawyer who wants to buy a birthday gift for his partner.
What are their priorities?
What is important to your target user? Why are they looking for alternatives to existing solutions?- Woodworking tool: Mary mainly cares about the weight and noise level of the tool—it should be light enough for one-handed use and quiet enough to be used inside an apartment in the city.
- E-commerce website: Harry wants to complete his task quickly, so he values a clean, easy-to-navigate design and the ability to find suitable products with minimal effort.
Learning about our users and their priorities can give us a clearer sense of where to focus our efforts. If current solutions fall short in the dimensions our users care most about, then we’ve identified a meaningful gap—a real problem that’s worth solving.
The next step is to explore an innovative idea: a way to address this problem more effectively than existing alternatives, at least for this specific group of users. We may not yet know whether such a solution is technically feasible, but the gap itself justifies further exploration to better satisfy our users’ needs.
Research Outcome: Knowledge Gain
In the world of consumer products, an innovative solution often addresses unmet needs or improves a frustrating and inefficient user experience. In research, we also aim to advance the state of the art. That might mean filling a gap in knowledge, or developing a new method, material, or process with improved properties. In your area of expertise, you’re probably already aware of something that could be improved—where existing approaches fall short and where your idea might offer a better solution.
Research goals are often shaped by the analytical methods we use, so clarifying the type of question we’re addressing can sharpen our focus (Section 2.3.1). While research doesn’t have “users” in the commercial sense, our work is still judged by peers. To convince them of its value—e.g., to get a paper accepted—we must demonstrate that our approach outperforms existing ones on the criteria that matter. For this, we rely on evaluation metrics that help quantify our idea’s advantages (Section 2.3.2).
Types of Research Questions
Most research questions can be categorized into four broad groups, each associated with a specific type of analytics approach (Figure 2.2).
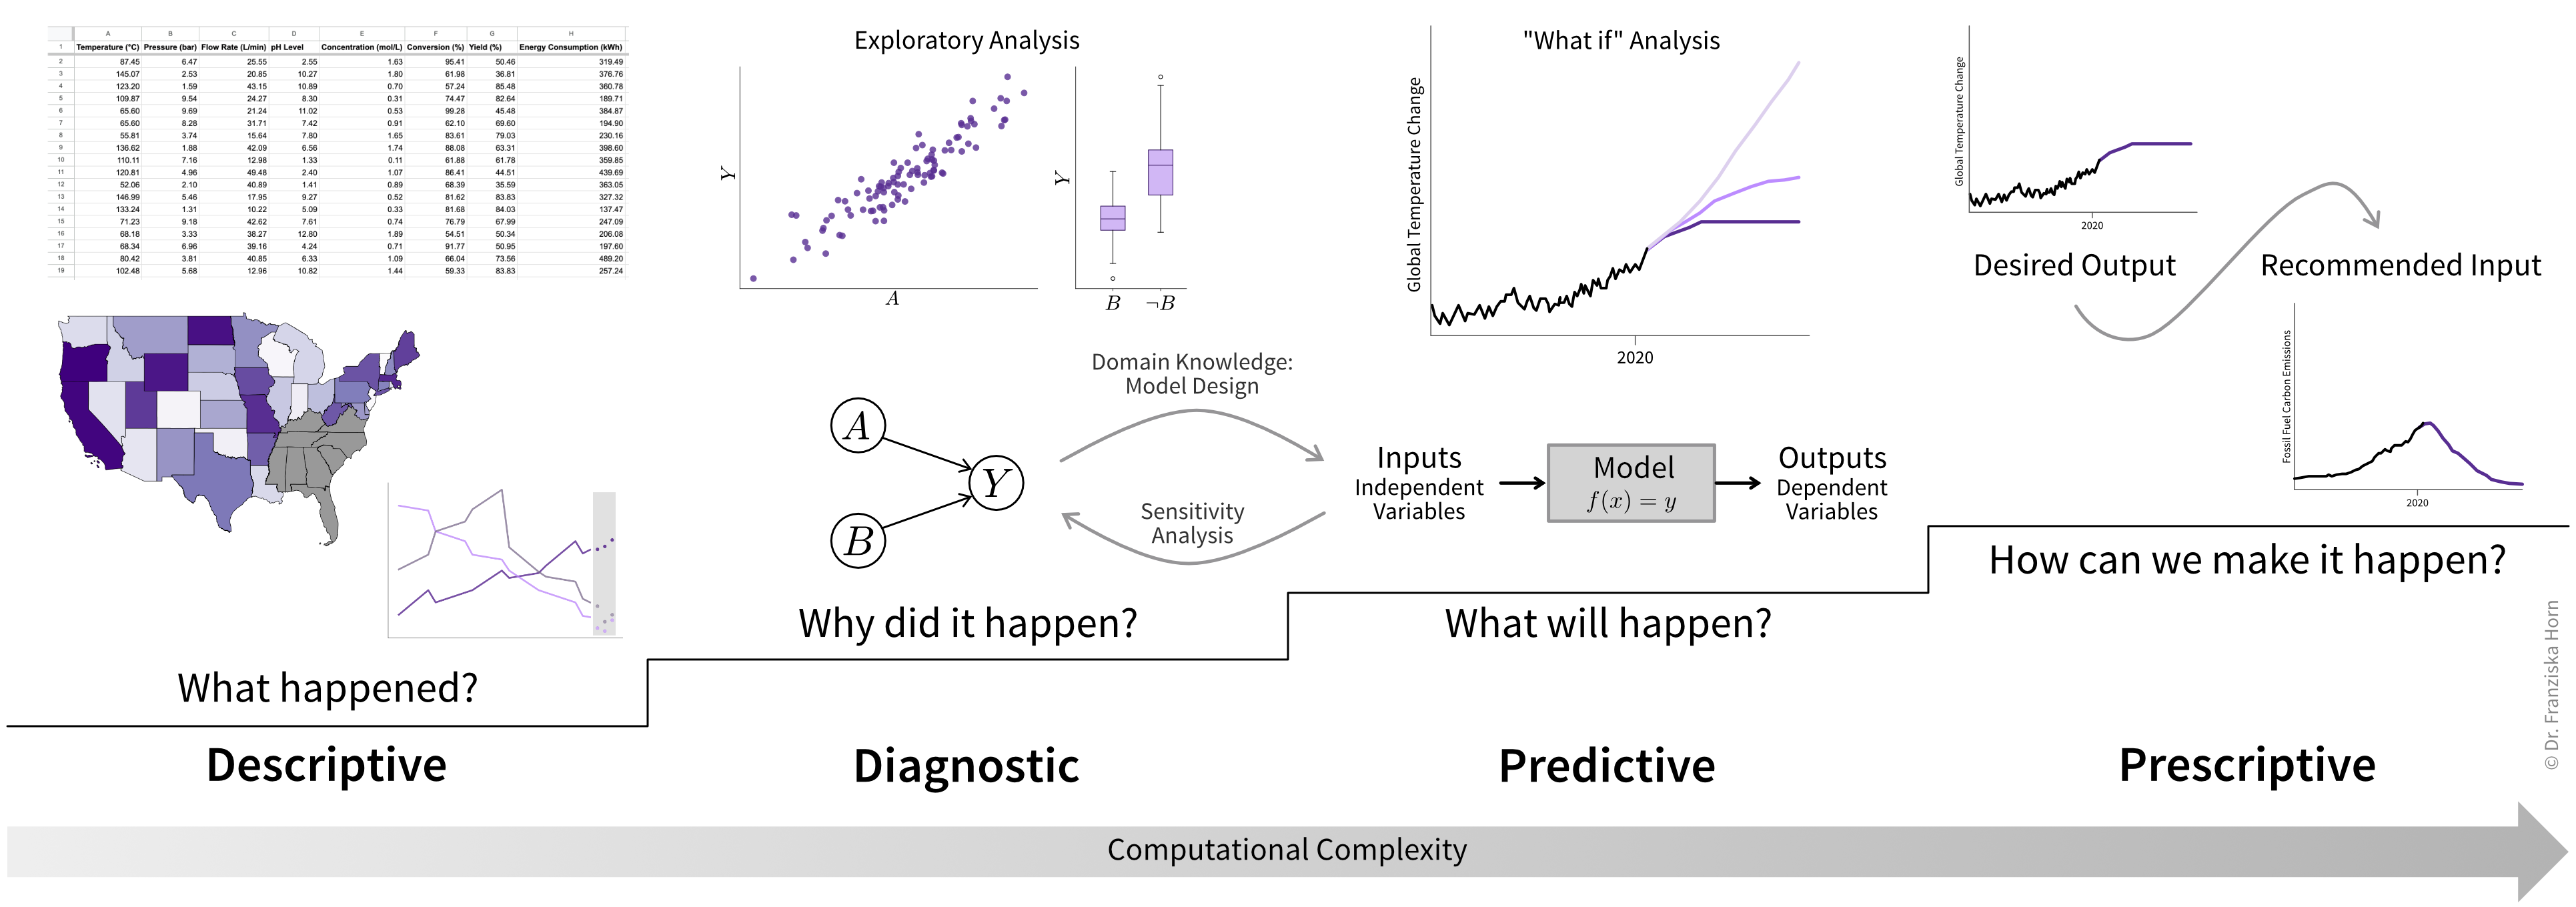
Descriptive Analytics
This approach focuses on observing and describing phenomena to establish baseline measurements or track changes over time.
Examples include:
- Identifying animal and plant species in unexplored regions of the deep ocean.
- Measuring the physical properties of a newly discovered material.
- Surveying the political views of the next generation of teenagers.
Methodology:
- Collect a large amount of data (e.g., samples or observations).
- Calculate summary statistics like averages, ranges, or standard deviations.
Diagnostic Analytics
Here, the goal is to understand relationships between variables and uncover causal chains to explain why phenomena occur.
Examples include:
- Investigating how CO2 emissions from burning fossil fuels drive global warming.
- Evaluating whether a new drug reduces symptoms and under what conditions it works best.
- Exploring how economic and social factors influence shifts toward right-wing political parties.
Methodology:
- Perform exploratory data analysis, such as looking for correlations between variables.
- Conduct statistical tests to support or refute hypotheses (e.g., comparing treatment and placebo groups).
- Design of experiments to control for external factors (e.g., randomized clinical trials).
- Build predictive models to simulate relationships. If the predictions from these models match new real-world observations, it suggests their assumptions correctly represent causal effects.
Predictive Analytics
This method involves building models to describe and predict relationships between independent variables (inputs) and dependent variables (outputs). These models often rely on insights from diagnostic analytics, such as which variables to include in the model and how they might interact (e.g., linear or nonlinear dependence). Despite its name, this approach is not just about predicting the future, but used to estimate unknown values in general (e.g., variables that are difficult or expensive to measure). It also includes any kind of simulation model to describe a process virtually (i.e., to conduct in silico experiments).
Examples include:
- Weather forecasting models.
- Digital twin of a wind turbine to simulate how much energy is generated under different conditions.
- Predicting protein folding based on amino acid sequences.
Methodology:
The key difference lies in how much domain knowledge informs the model:
White-box (mechanistic) models: Based entirely on known principles, such as physical laws or experimental findings. These models are often manually designed, with parameters fitted to match observed data.
Black-box (data-driven) models: Derived primarily from observational data. Researchers usually test different model types (e.g., neural networks or Gaussian processes) and choose the one with the highest prediction accuracy.
Gray-box (hybrid) models: These combine mechanistic and data-driven approaches. For example, the output of a mechanistic model may serve as an input to a data-driven model, or the data-driven model may predict residuals (i.e., prediction errors) from the mechanistic model, where both outputs combined yield the final prediction.
TipResources to learn more about data-driven modelsIf you want to learn more about how to create data-driven models and the machine learning (ML) algorithms behind them, these two free online books are highly recommended:
- [4] Supervised Machine Learning for Science by Christoph Molnar & Timo Freiesleben; a fantastic introduction focused on applying black-box models in scientific research.
- [6] A Practitioner’s Guide to Machine Learning by me; a broader overview of ML methods for a variety of use cases.
Provided the developed model is sufficiently accurate, researchers can then analyze its behavior (e.g., through a sensitivity analysis, which examines how outputs change with varying inputs) to gain further insights about the modeled system itself (to feed back into diagnostic analytics).
Prescriptive Analytics
This approach focuses on decision-making and optimization, often using predictive models.
Examples include:
- Screening thousands of drug candidates to find those most likely to bind with a target protein.
- Optimizing reactor conditions to maximize yield while minimizing energy consumption.
Methodology:
Decision support: Use models for “what-if” analyses to predict outcomes of different scenarios. For example, models can estimate the effects of limiting global warming to 2°C versus exceeding that threshold, thereby informing policy decisions.
Decision automation: Use models in optimization loops to systematically test input conditions, evaluate outcomes (e.g., resulting predicted material quality), and identify the best conditions automatically.
ImportantModel accuracy is crucialThese recommendations are only as good as the underlying models. Models must accurately capture causal relationships and often need to extrapolate beyond the data used to build them (e.g., for disaster simulations). Data-driven models are typically better at interpolation (predicting within known data ranges), so results should ideally be validated through additional experiments, such as testing the recommended new materials in the lab.
Together, these four types of analytics form a powerful toolkit for tackling real-world challenges: descriptive analytics provides a foundation for understanding, diagnostic analytics uncovers the causes behind observed phenomena, predictive analytics models future scenarios based on this understanding, and prescriptive analytics turns these insights into actionable solutions. Each step builds on the previous one, creating a systematic approach to answering complex questions and making informed decisions.
Evaluation Metrics
To demonstrate the impact of our work and compare our solution against existing approaches, it’s crucial to define what success looks like quantitatively. Consider these common evaluation metrics to measure the outcome of your research and generate compelling results:
- Number of samples: This refers to the amount of data you’ve collected, such as whether you surveyed 100 or 10,000 people. Larger sample sizes can provide more robust and reliable results. It is also important to make sure your sample is representative of the population as a whole, i.e., to avoid sampling bias, which can cause misleading results and incorrect conclusions.
- Reliability of measurements: This evaluates the consistency of your data. For example, how much variation occurs if you repeat the same measurement or run a simulation with different random seeds. This is important as others need to be able to reproduce your results.
- Statistical significance: The outcome of a statistical hypothesis test, such as a p-value that indicates whether the difference in symptom reduction between the treatment and placebo groups is significant.
- Model accuracy: For predictive models, this includes:
- Standard metrics like \(R^2\) to measure how closely the model’s predictions align with observational data.
- Cross-validation scores to assess performance on new data.
- Uncertainty estimates to understand how confident the model is in its predictions.
- Algorithm performance: This includes metrics like memory usage and the time required to fit a model or make predictions, and how these values change as the dataset size increases. Efficient algorithms are crucial when scaling to large datasets or handling complex simulations.
- Key Performance Indicators (KPIs): Any other practical measures that matter in your field. For example:
- For a chemical process: yield, purity, energy efficiency.
- For a new material: strength, durability, cost.
- For an optimization task: convergence time, solution quality.
Our evaluation typically involves multiple metrics. For example, in prescriptive analytics, we need to demonstrate both the accuracy of our model and that the recommendations generated with it led to a genuinely optimized process or product.
Before starting your research, review similar work in your field to understand which metrics are standard in your community.
Draw Your Idea
Whether you’re collaborating with colleagues, presenting at a conference, or writing a paper—it is essential to clearly communicate the problem you’re solving and your proposed solution.
Visual representations are particularly powerful for conveying complex ideas. One effective approach is creating “status quo vs. your contribution” visuals that contrast the current state of the field with your proposed improvements (Figure 2.3).
The “status quo” depiction might show a lack of data, an incomplete understanding of a phenomenon, poor model performance, or an inefficient process or material. The “your contribution” diagram highlights how your research addresses these issues and improves on the current state, such as refining a predictive model or enhancing the properties of a new material.
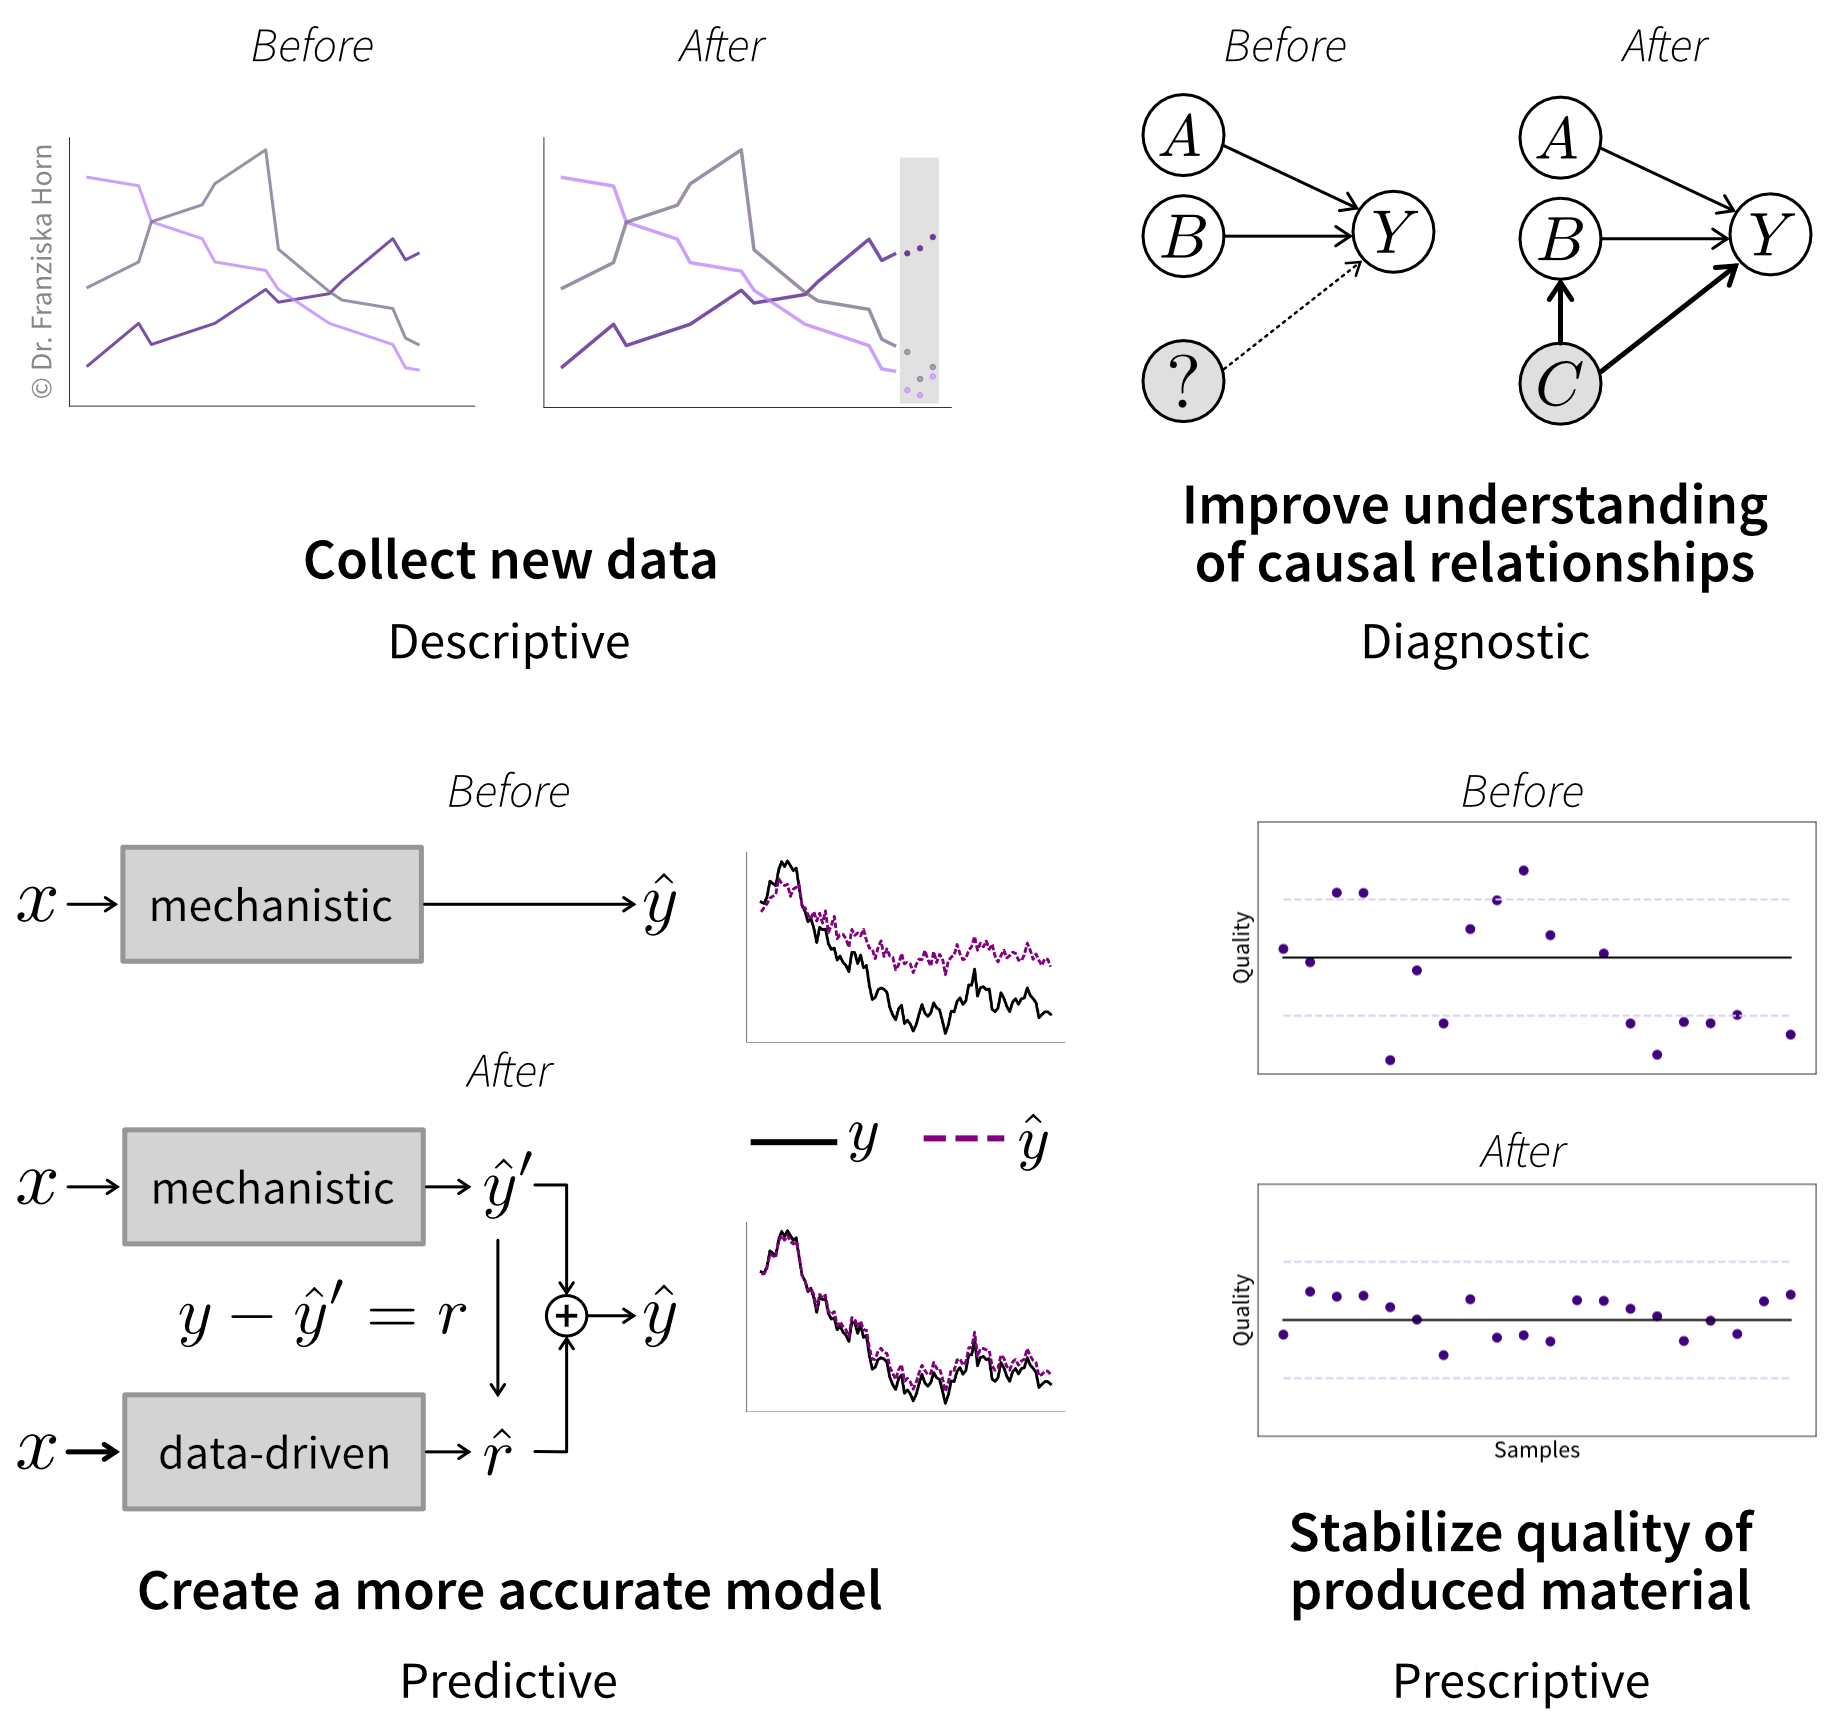
At this point, the diagram showing “your contribution” might be based on a hypothesis or an educated guess about what your results will look like—and that’s totally fine! The purpose of visualizing your solution is to guide your development process. Later, you can update the picture with actual results if you decide to include it in a journal publication, for example.
Of course, not all ideas are tied directly to analytics. Sometimes the main improvement is more qualitative, for example, focusing on design or functionality (Figure 2.4).
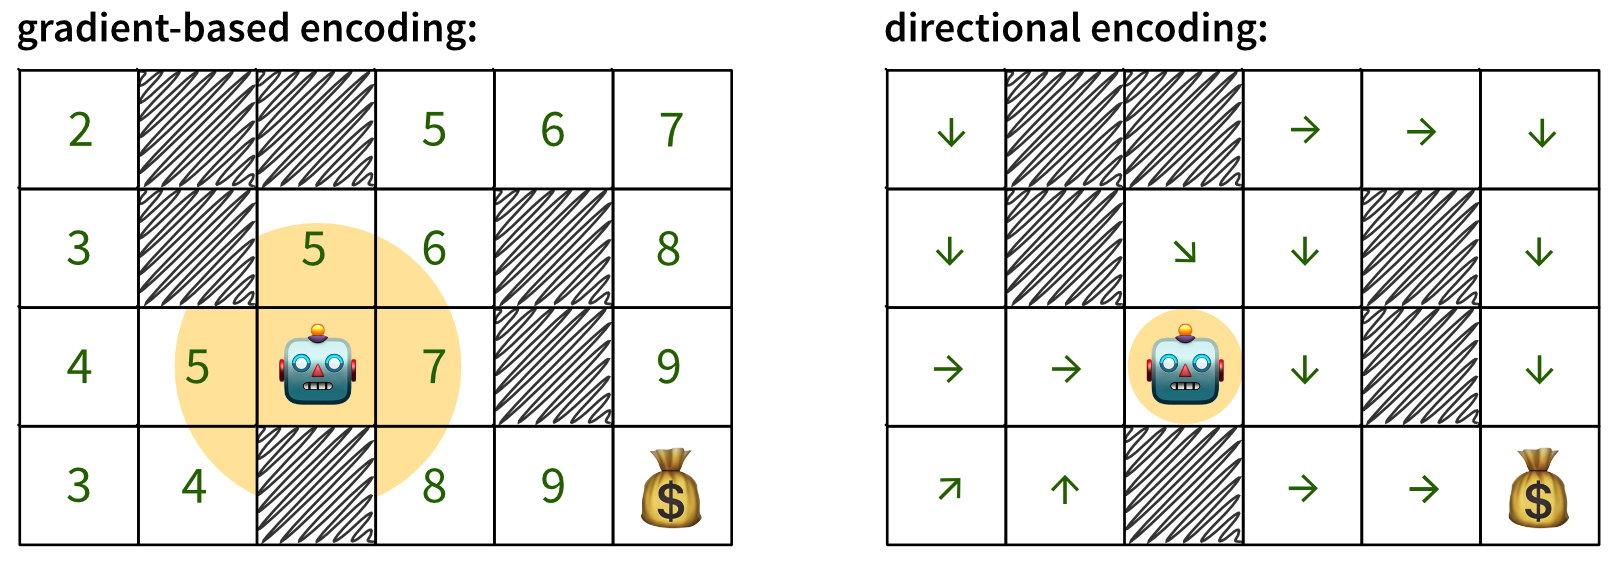
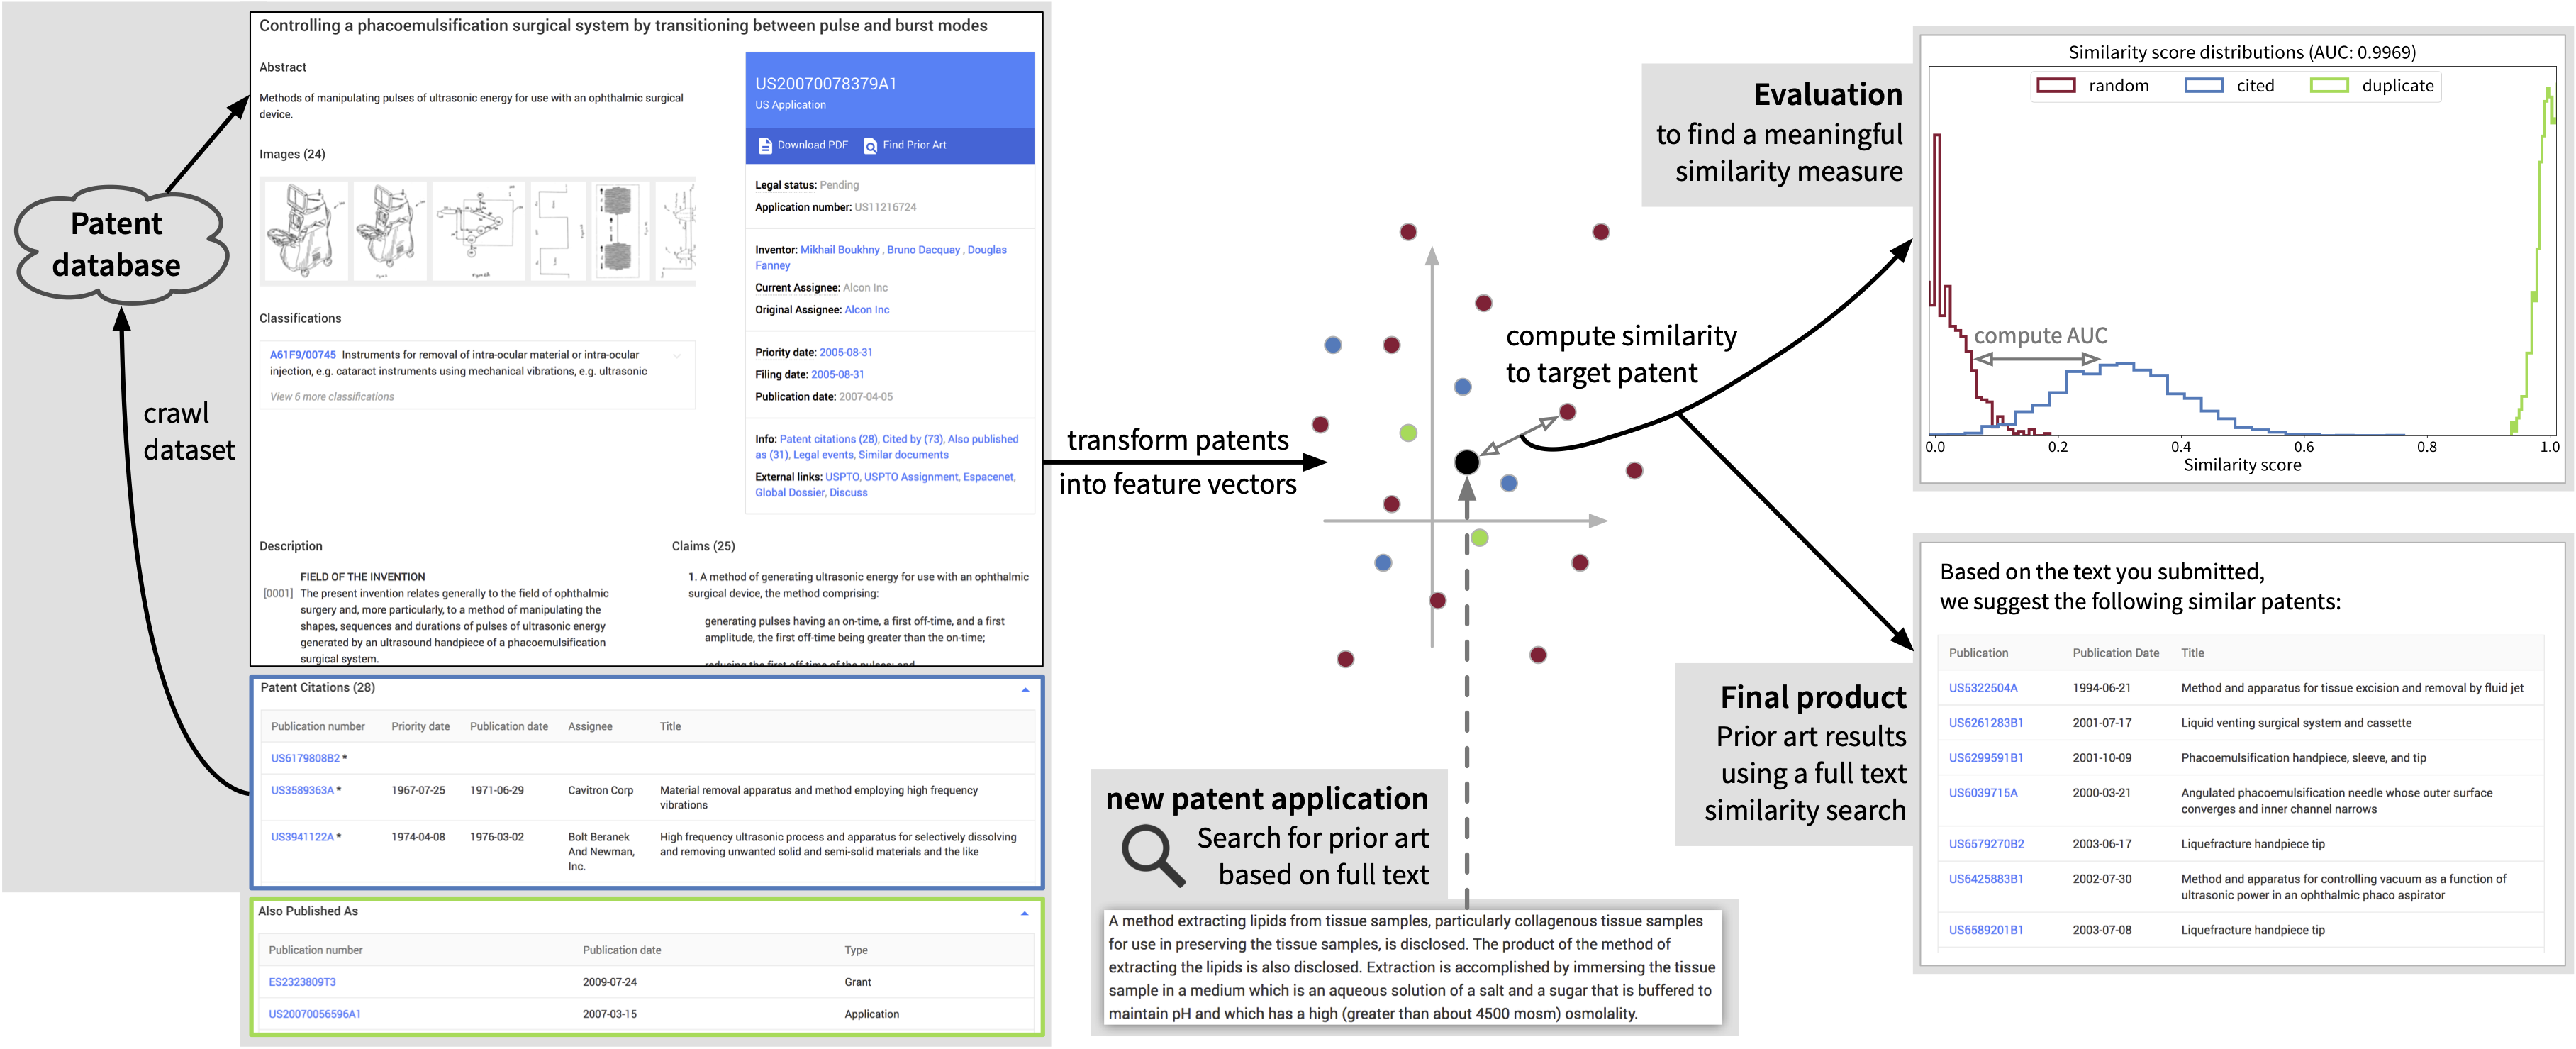
If existing solutions are not directly comparable or so well known that they require no further explanation, a “status quo” illustration might not be necessary and you can focus solely on “your contribution” (Figure 2.5).
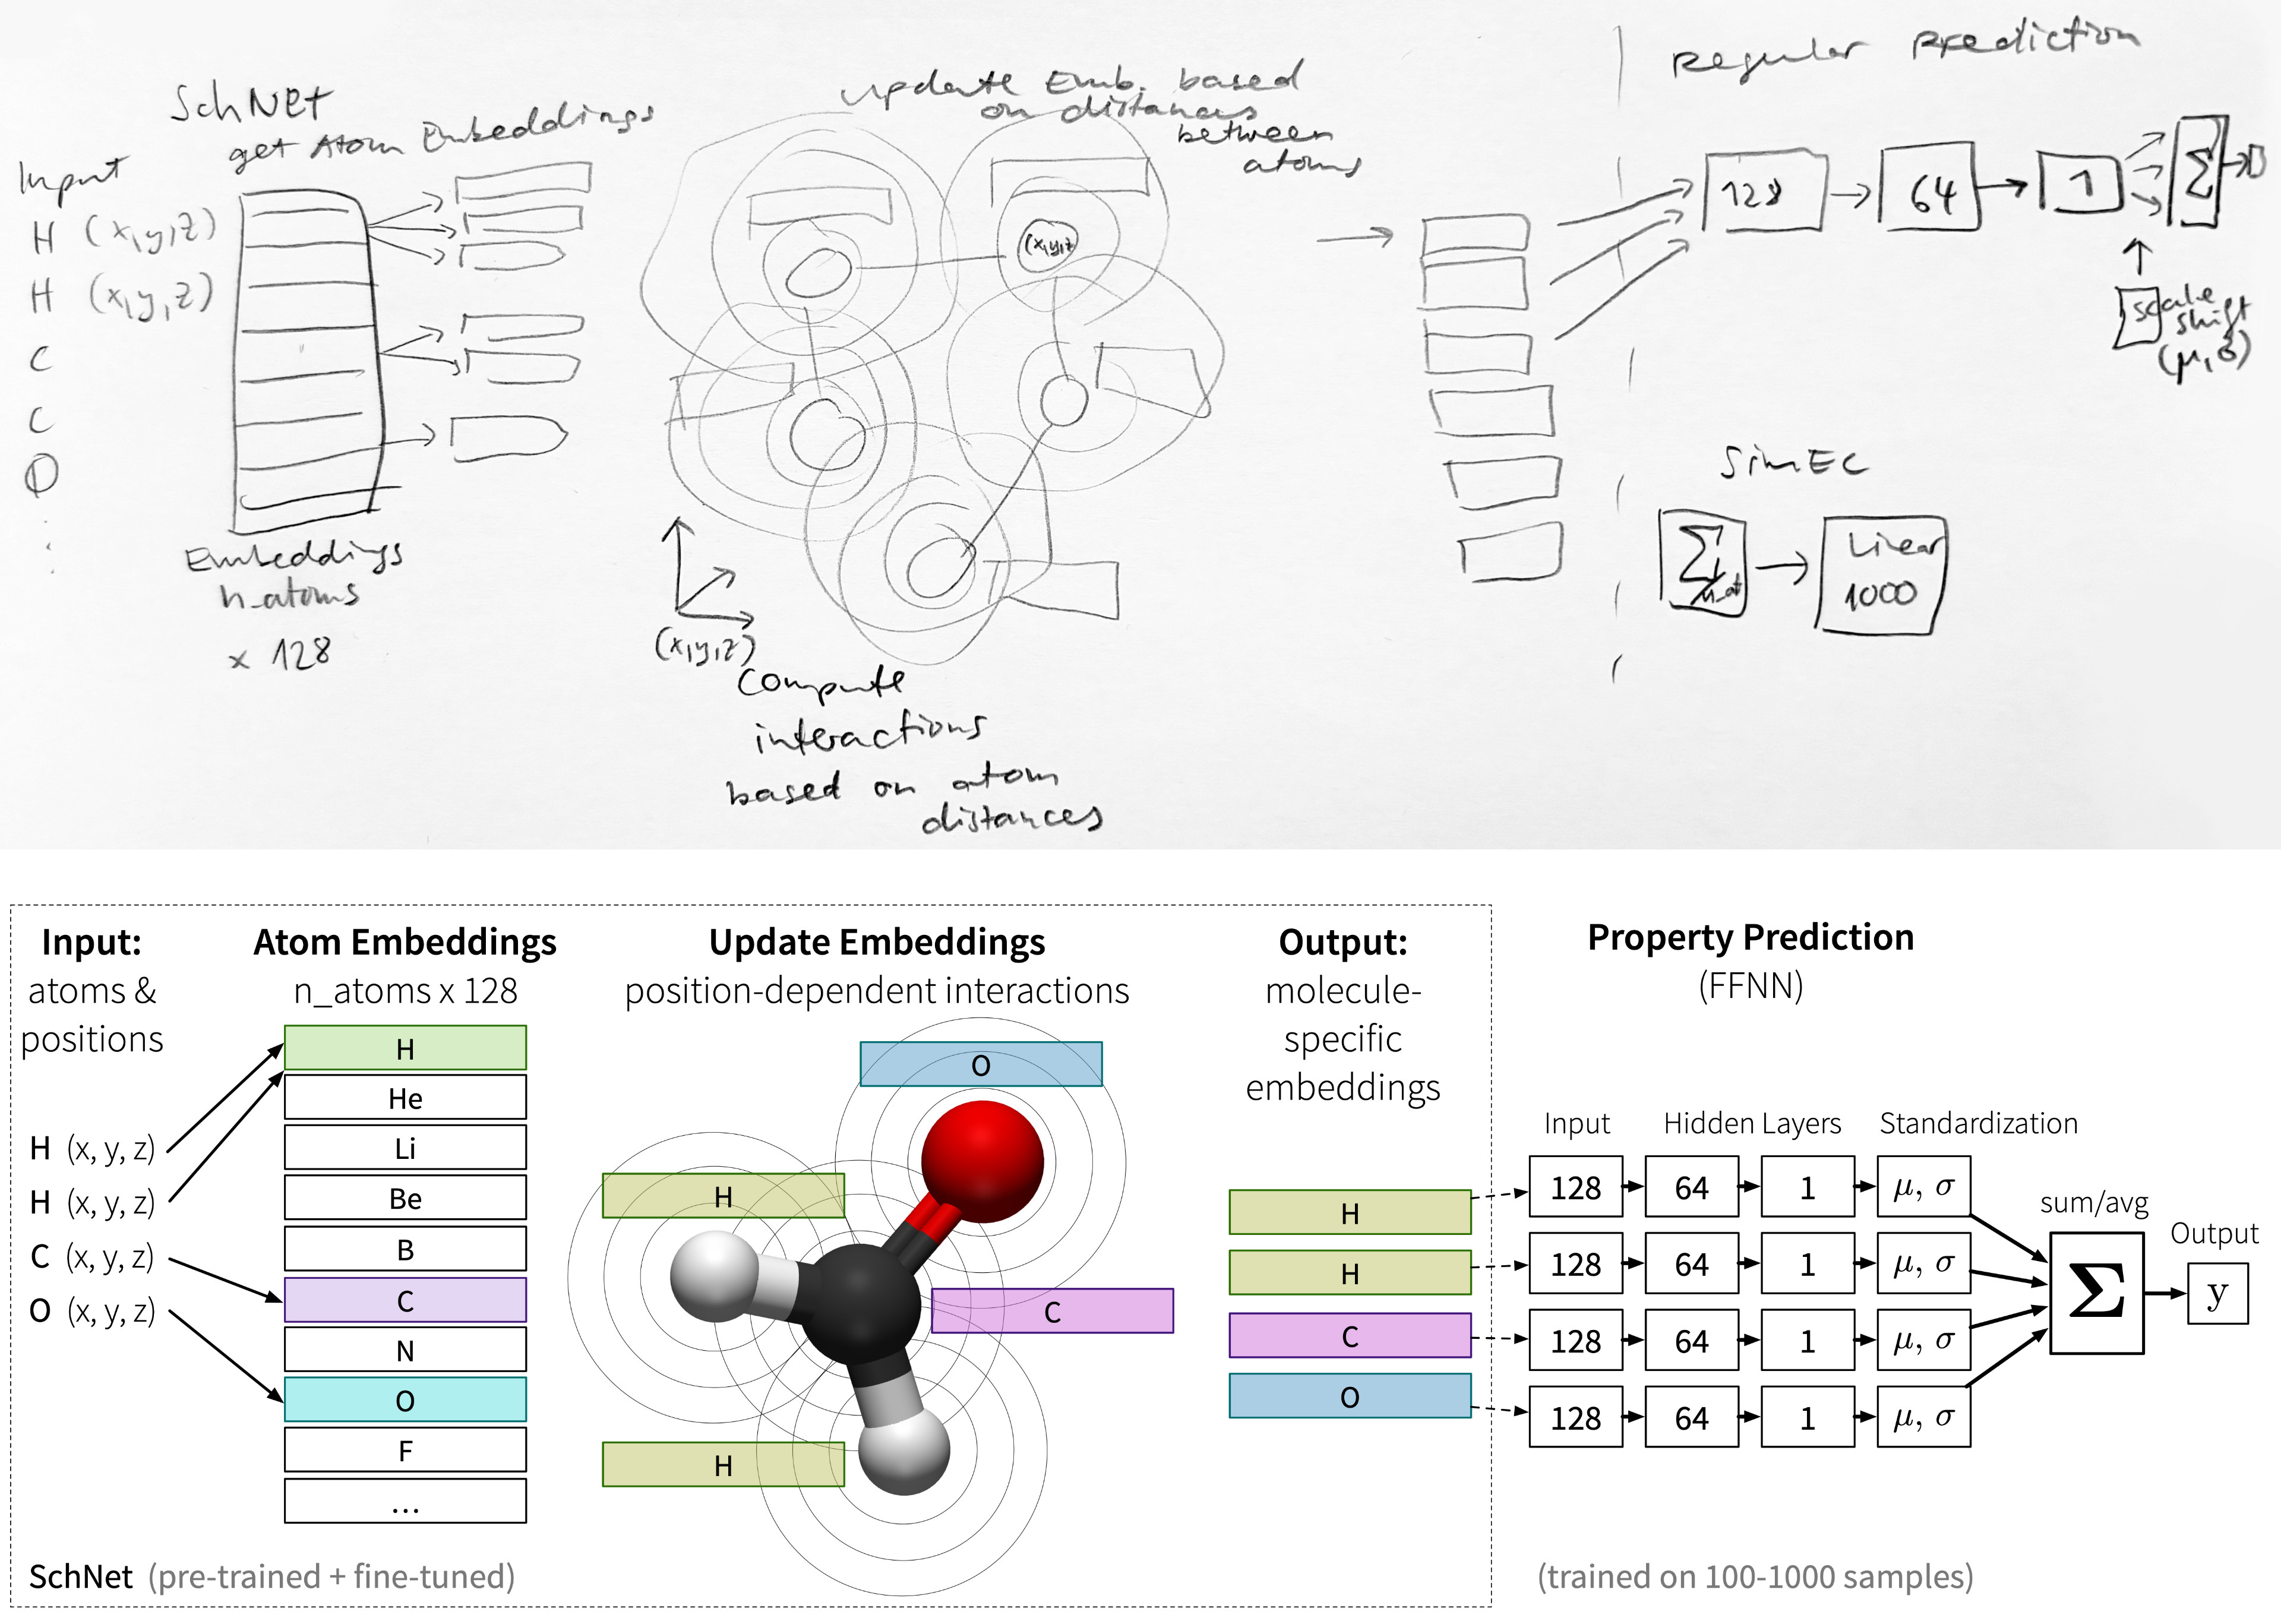
Of course, the examples shown here are already refined for publication—your initial sketches will probably look a bit messier (Figure 2.6). Have a look at [3] for some tips on communicating science through visualizations and creating insightful graphics.
Give it a try—does the sketch help you explain your research to your family?
Draw Your Advantage
Ideally, you should already have an idea of how existing approaches perform on relevant evaluation metrics (e.g., based on findings from other publications) to establish the baseline your solution should outperform. You’ll likely need to replicate at least some of these baseline results (e.g., by reimplementing existing models) to ensure your comparisons are not influenced by external factors. But understanding where the “competition” stands can also help you identify secondary metrics where your solution could excel. For example, even if there’s little room to improve model accuracy, existing solutions might be too slow to handle large datasets efficiently.1
To make explicit how you expect your solution will compare against existing baselines, create a graph that illustrates the gap your approach aims to fill (Figure 2.7).
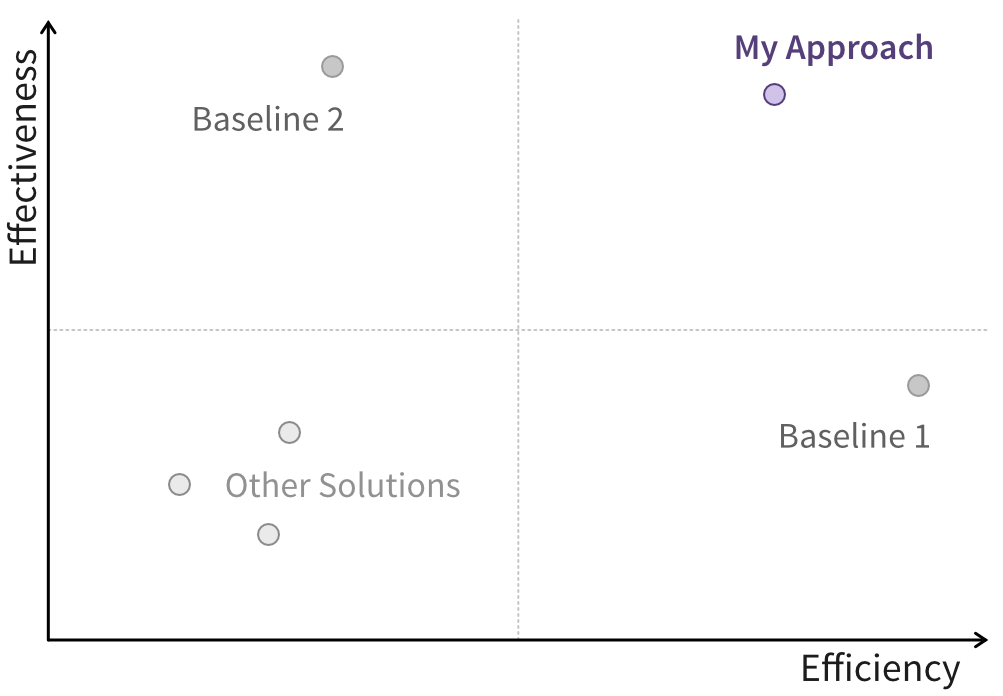
Of course, at this stage, your solution’s performance is still aspirational. But clearly defining the key metrics to demonstrate your research’s impact will help you focus your programming efforts effectively.
At this point, you should have a clear understanding of:
- The problem you’re trying to solve.
- Existing solutions to this problem, i.e., the baseline you’re competing against.
- Which metrics should be used to quantify your improvement on the current state.
For example, currently, a lot of research aims to replace traditional mechanistic models with data-driven machine learning models, as these enable significantly faster simulations. A notable example is the AlphaFold model, which predicts protein folding from amino acid sequences—a breakthrough so impactful it was recognized with a Nobel Prize [2]!↩︎