Model Evaluation
Since in supervised learning problems we know the ground truth, we can objectively evaluate different models and benchmark them against each other.
Evaluation Metrics
We start with three evaluation metrics for regression problems: the mean absolute error, mean squared error, and \(R^2\).
- Mean absolute error (MAE)
-
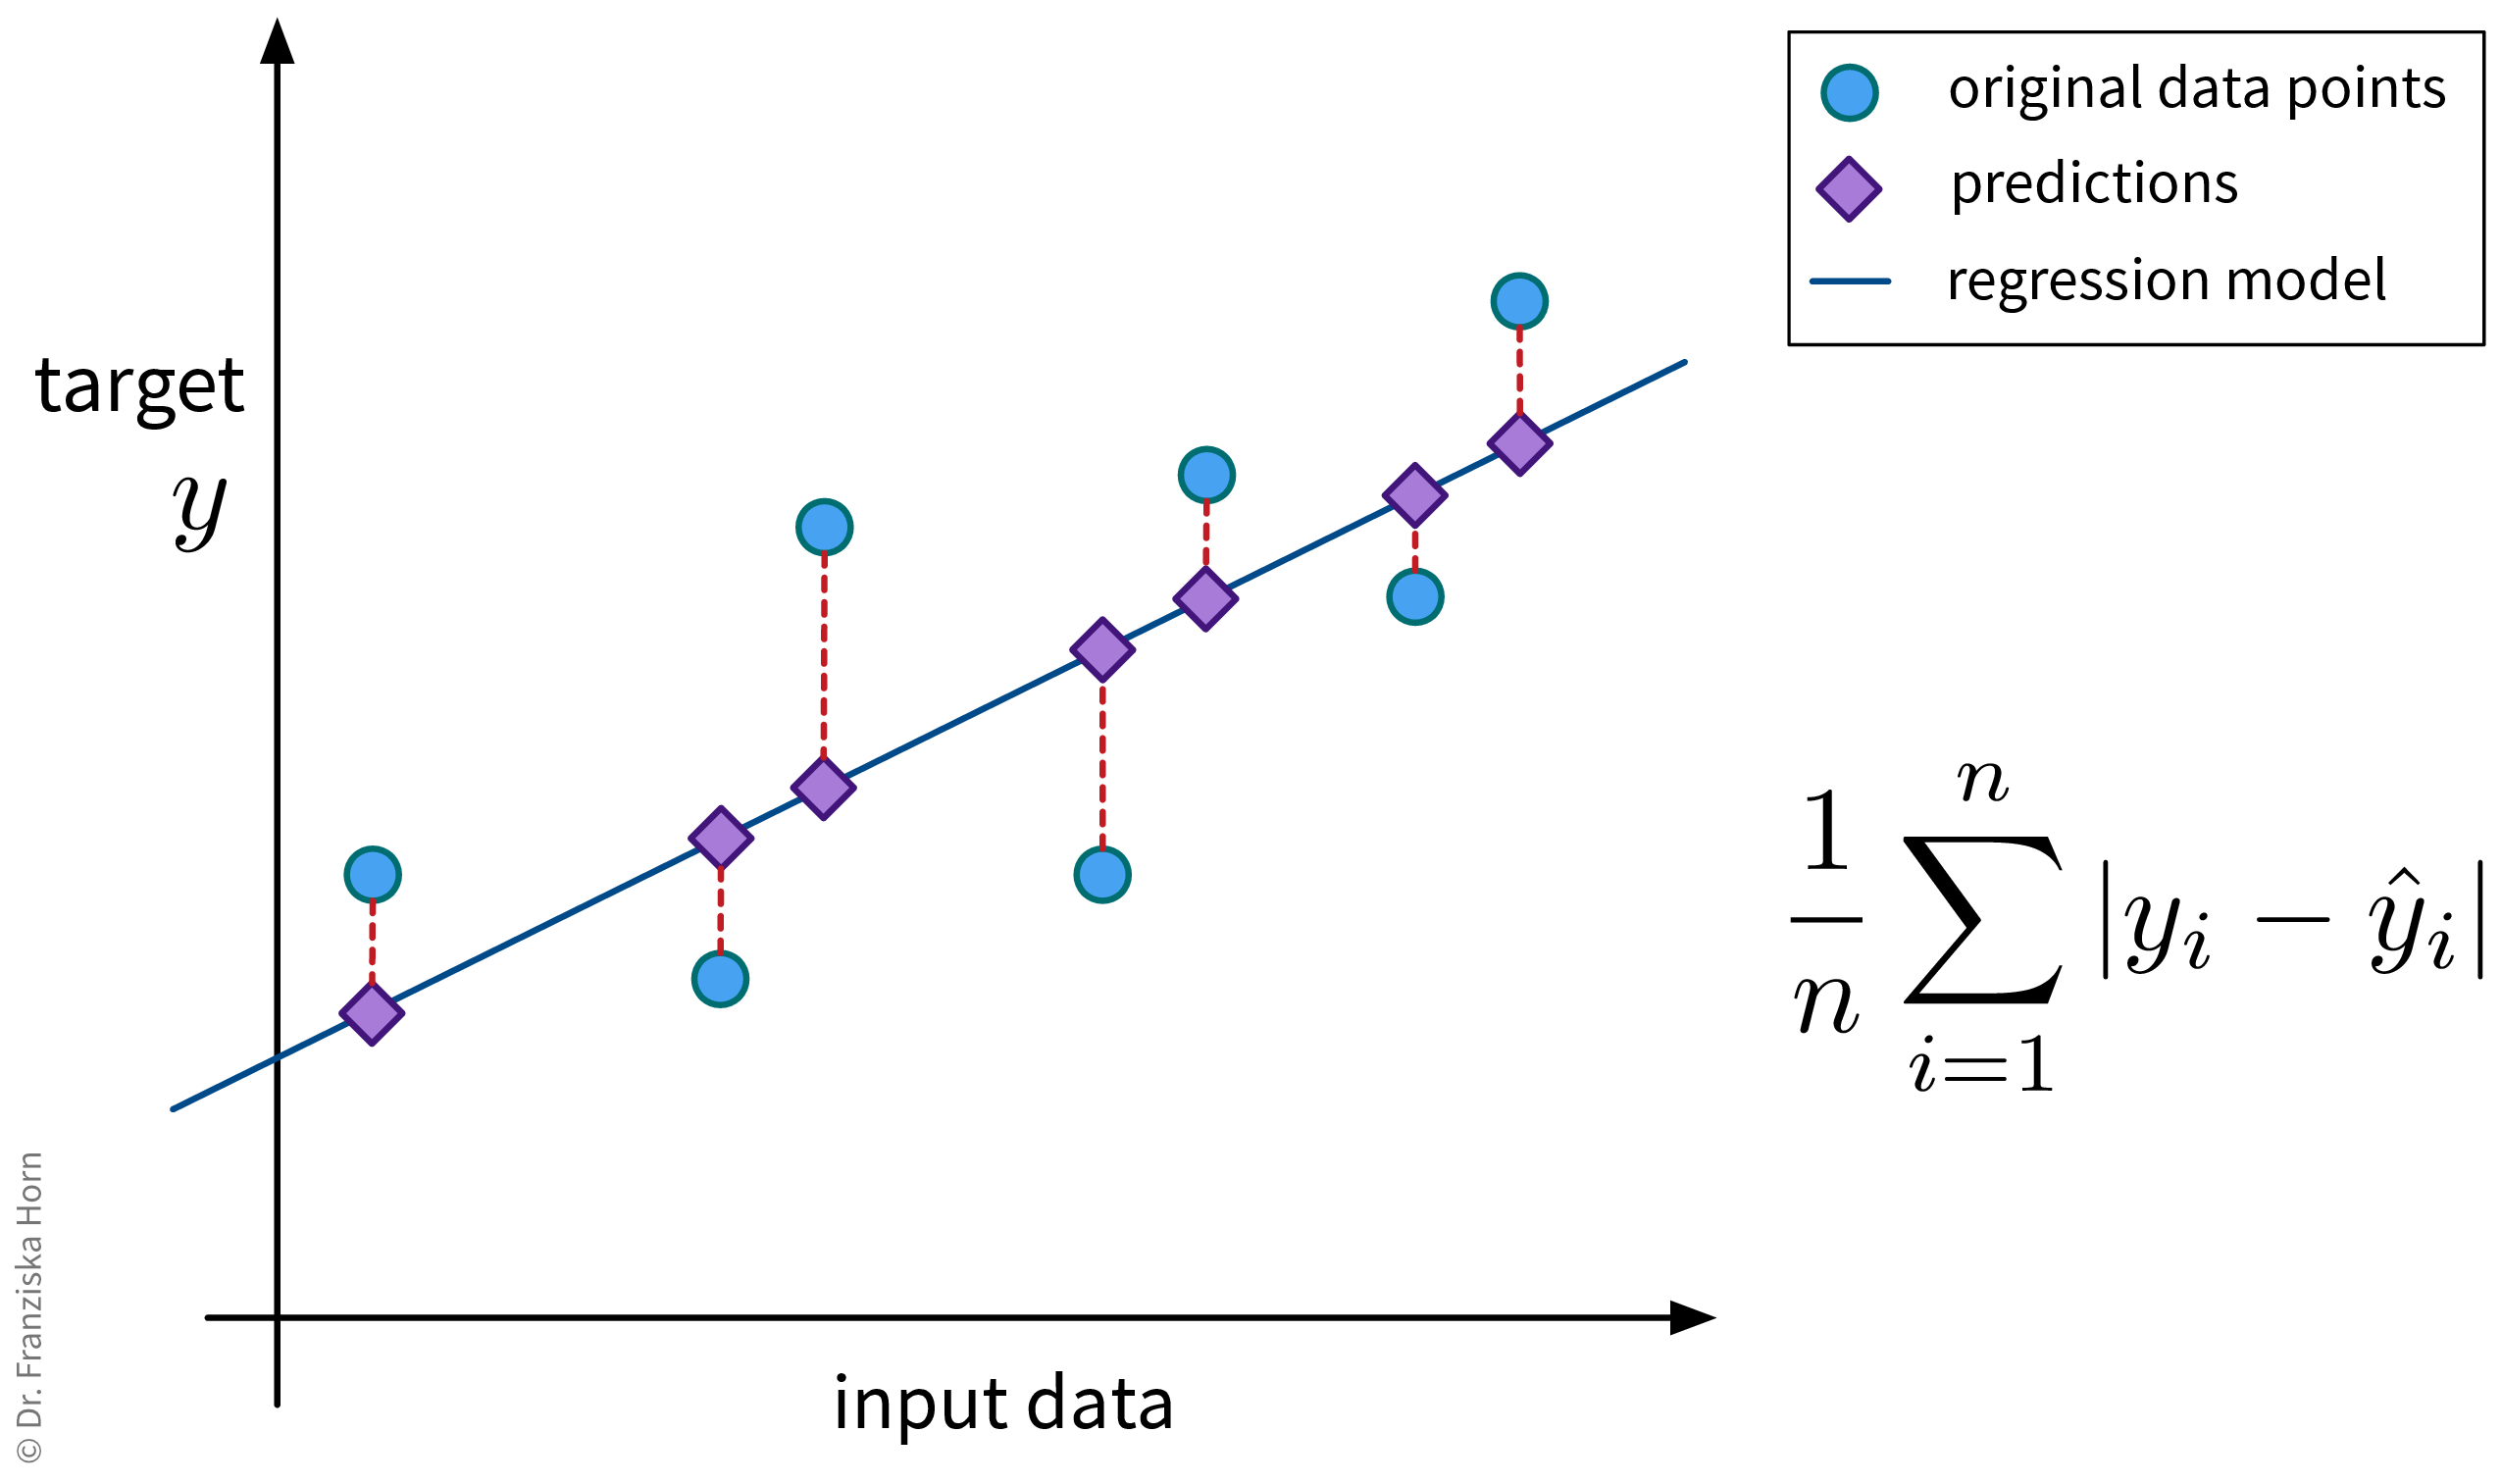 This is probably the most straightforward regression error metric and additionally easy to interpret since the error is given in the same units of measurement as the target variable (e.g., if we’re predicting a price in euros, we would know exactly by how many euros the model is off on average).
from sklearn.metrics import mean_absolute_error- Mean squared error (MSE)
-
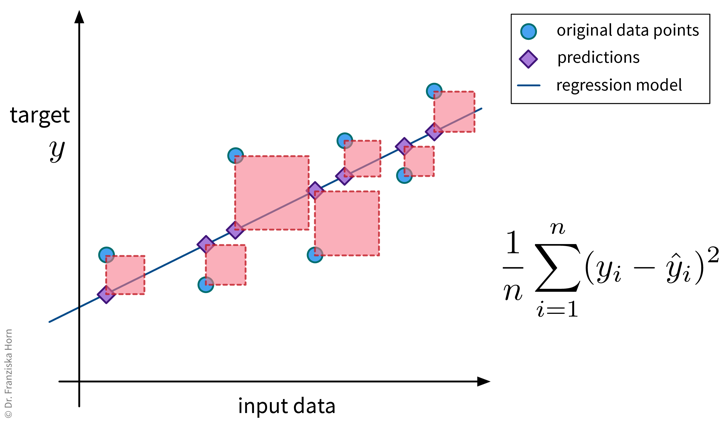 Since this regression error metric is differentiable, it is often used internally when optimizing the parameters of a model (e.g., in linear regression). When reporting the final error of a model, one often takes the square root of the result, i.e., instead reports the root mean squared error (RMSE), since this is again in the same units as the original target variable (but still less intuitive than the MAE).
from sklearn.metrics import mean_squared_error- \(R^2\)
-
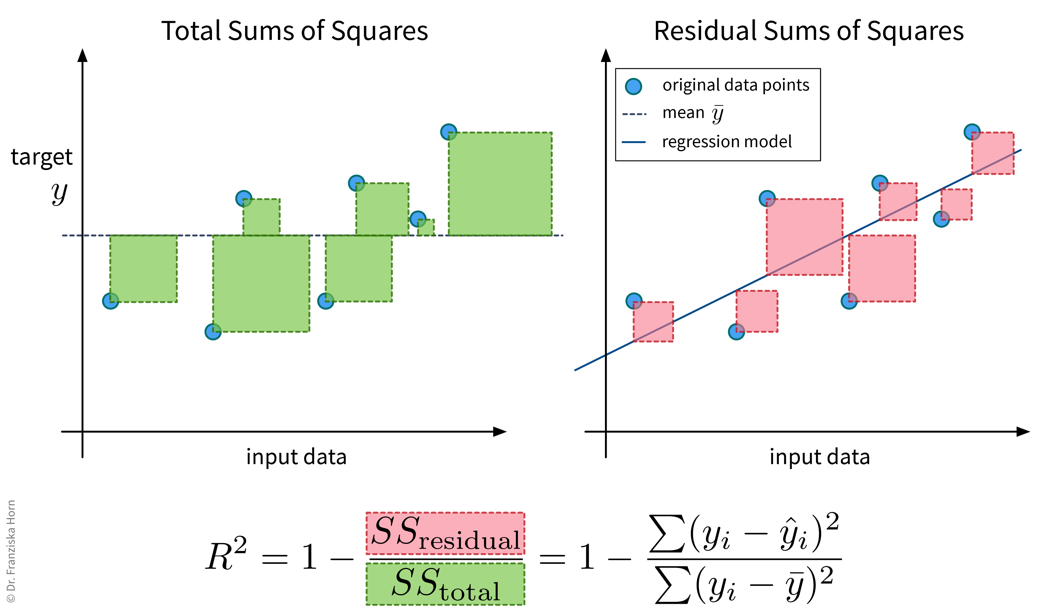 The \(R^2\), or coefficient of determination, essentially compares the MSE of a regression model against the MSE of the ‘stupid baseline’ for the regression (i.e., predicting the mean), i.e., it normalizes the MSE by the variance of the data. In the best case, the \(R^2\) is 1, i.e., when the model explains the data perfectly, and in the worst case, it can even become negative, i.e., when the model performs worse then simply predicting the mean.
from sklearn.metrics import r2_scoreNow lets look at evaluation metrics for classification problems.
- Classification errors in detail
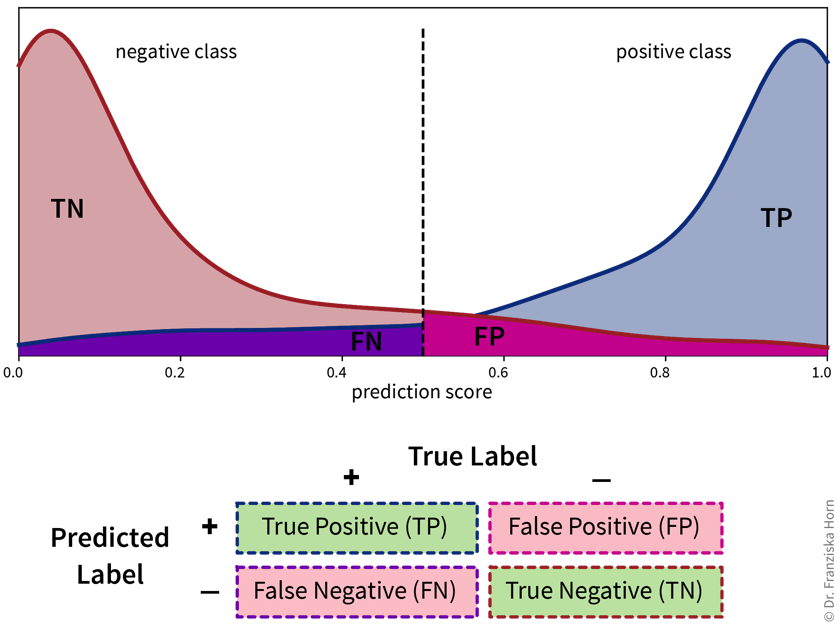
- Accuracy
-
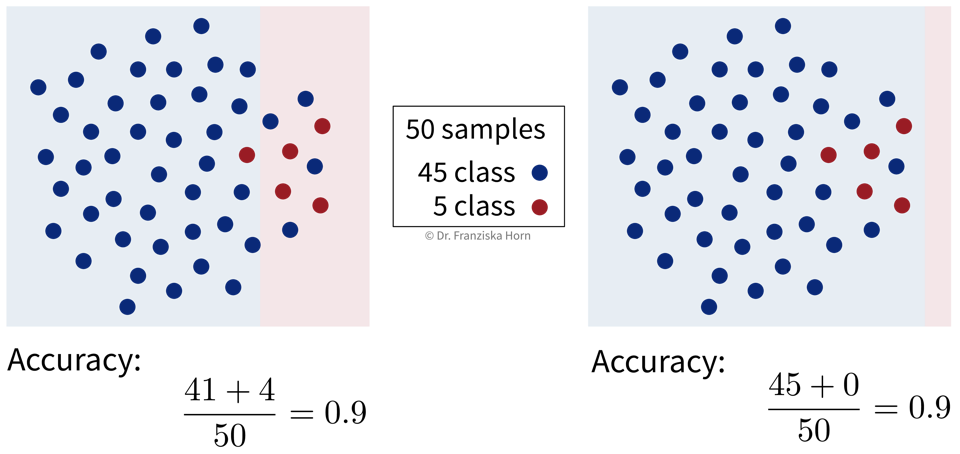
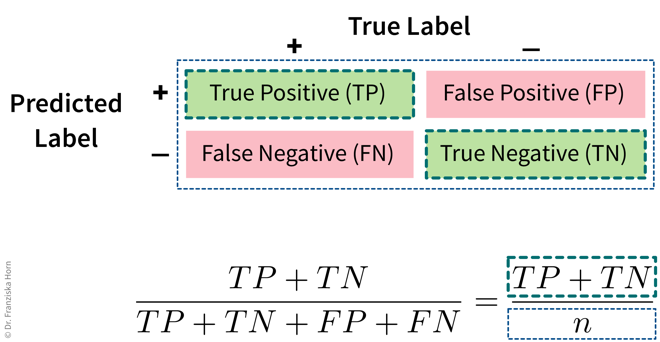 The accuracy is the most widely used classification evaluation metric, where we simply check, out of all samples, how many were classified correctly (i.e., TP and TN). However, this can be misleading for unequal class distributions and we should always compare the accuracy of the model against the ‘stupid baseline’ for classification, i.e., what the accuracy would be for a “model” that always predicts the most frequent class.
from sklearn.metrics import accuracy_score- Balanced Accuracy
-
To avoid pitfalls of accuracy: consider misclassification rates of both classes separately:
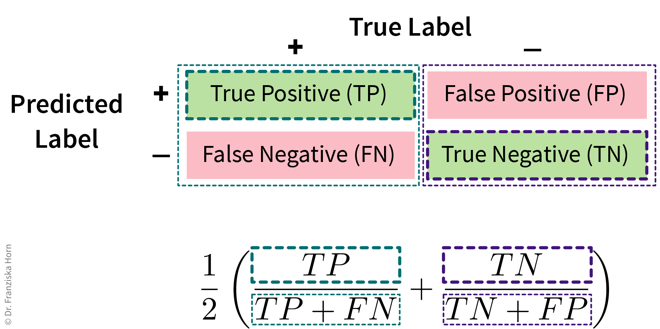
from sklearn.metrics import balanced_accuracy_score- Multi-class problems: micro vs. macro averaging
-
The accuracy and balanced accuracy scores can be generalized to the multi-class classification case. Here we instead use the terms micro- and macro-averaging to describe the two strategies (which can also be used for other kinds of metrics like the F1-score), where micro-averaging means we compute the score by averaging over all samples, while macro-averaging means we first compute the score for each class separately and then average over the values for the different classes.
Micro-averaged score (→ accuracy_score):
\(n_{c}\) : number of samples belonging to class \(c\)
\(TP_{c}\) : number of correctly classified samples from class \(c\)
Macro-averaged score (→ balanced_accuracy_score):
- Multi-class problems: Confusion matrix
-
Similarly, the table with the TP/FP/TN/FN entries can be extended for the multi-class classification case:
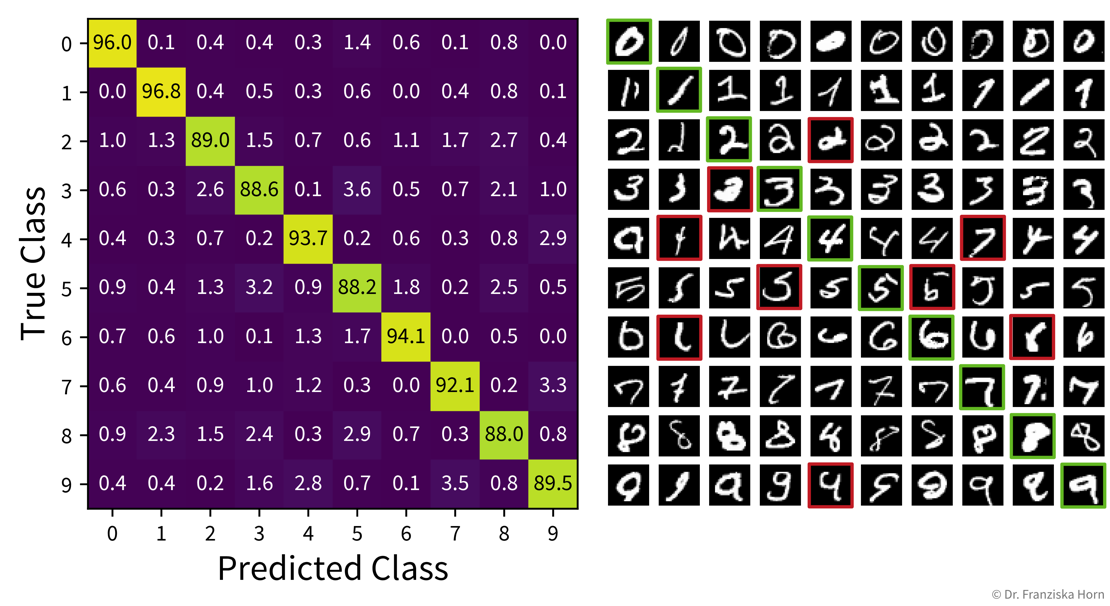 The heatmap on the left shows the (normalized) confusion matrix for a ten-class classification problem (recognizing handwritten digits), while the plot on the right shows example images for each case. Examining the confusion matrix and some individual examples can give us more faith in the predictions of our model, as we might realize that some misclassifications (highlighted in red) could also happen to a human, e.g., the 4 that was classified as a 1 or even the 4 that was classified as a 7 (which might even be a labeling error from when the dataset was originally created).
from sklearn.metrics import confusion_matrixModel Selection
After we’ve chosen an appropriate evaluation metric for our problem, we can use the resulting scores to automatically select the best hyperparameters for a model and ultimately the best model.
- The case for an additional validation set
-
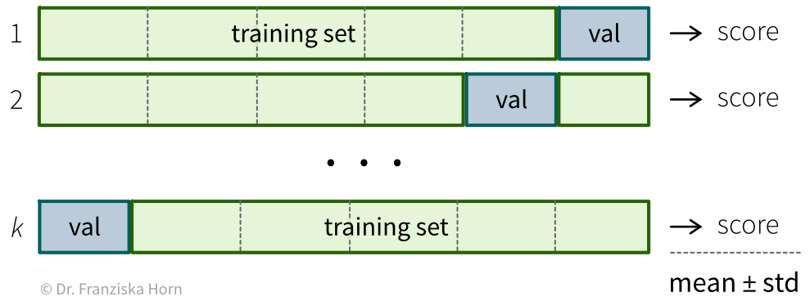
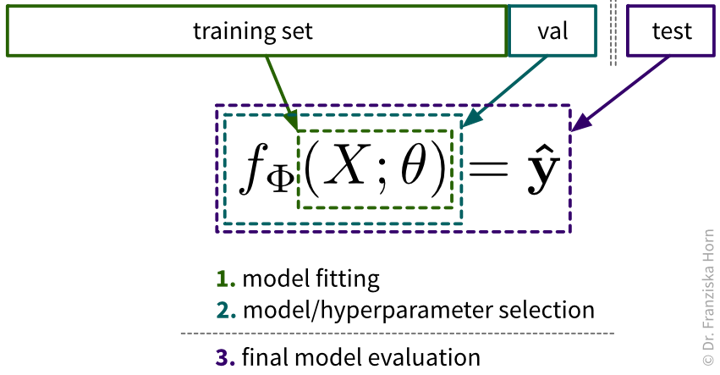 As we’ve established in the beginning, before experimenting with any models, the dataset should be split into a training and test set. However, this isn’t all: Since we are typically experimenting with many different types of models and for each model type with dozens of hyperparameter settings, we should not use this test set to evaluate each of these model candidates, since it might happen that with all these things we try out, we end up choosing a model that just by chance performs well on this test set, but does not generalize to new data later and we would have no way of finding this out before deploying the model in production. Therefore, we introduce a new data split, the validation set, that is used to evaluate the different candidate models, while the test set remains locked away until we’re ready to evaluate our final model to get a realistic estimate of how it performs on new data.
If the original dataset is quite big, say, over 100k samples (depending on the diversity of the data, e.g., the number of classes), then it is usually enough to just split the data into training, validation, and test sets at the start, where the validation and test sets contain about 10% of the data each and should be representative of the diversity of the original dataset. However, when the original dataset is smaller, it might not be possible to get such representative splits, which is when a technique called cross-validation (“x-val”) comes in handy.
| Especially when working with small datasets, it is important that these splits are well balanced, i.e., that all classes are represented equally in the training, validation, and test sets. This is also called stratified sampling. |
| Most datasets are collected over longer time periods. Often, the samples are correlated over time, i.e., samples collected around the same time are more similar to each other than samples collected weeks or months apart. This is often very apparent in time series data (e.g., seasonality effects in sales data), but it can also true for other types of data (e.g., the topics discussed in newspaper articles change over time; a camera lens might slowly accumulate dust). To get a realistic estimate of how well the model will perform on new data, it is usually best to use the most recent samples as the test set. Additionally, it might be necessary to use a time series split for the cross-validation, where the model is always trained on past data and evaluated on newer data. If there is a big difference between the model performance on random vs. chronological train/validation splits, this is a strong indication that the samples are correlated over time! |
- Hyperparameter Tuning
-
Often it is necessary to systematically evaluate a given model with different hyperparameter values to find the best settings. One straightforward approach for doing this is a grid search: In a grid search, we define the different values we want to test for each of the model’s hyperparameters and then all combinations of these different values for all hyperparameters are automatically evaluated, similar to how we would do it manually with nested for-loops. This is very useful, as often the different hyperparameter settings influence each other. Conveniently, sklearn furthermore combines this with a cross-validation. However, with many individual settings, this also comes at a computational cost, as the model is trained and evaluated \(k \times m_1 \times m_2 \times \dots \times m_i\) times, where \(k\) is the number of folds in the cross-validation and \(m_1...m_i\) are the number of values that need to be tested for each of the i hyperparameters of the model.
For example, with two hyperparameters, the grid search results could look something like the plot below, which shows a heatmap of the average accuracy achieved with each hyperparameter combination of a model in the cross-validation:
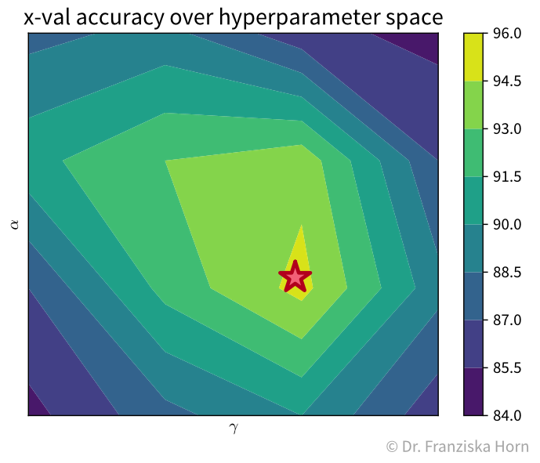
While sklearn’s grid search method tells us directly what the best hyperparameter combination is out of the ones it tested (marked with a red star in the plot), it is important to check the complete set of results to verify that we have covered the whole range of possible hyperparameter values that could give good results. For example, in the plot above, we see a peak in the middle with the results getting worse to the sides, i.e., we know that better hyperparameter values are unlikely to lie outside of the range we’ve tested.
It is generally a good idea to first start with a large range of values and then zoom in to the area that seems most promising. And of course knowledge about the different algorithms helps a lot in choosing reasonable settings as well.Besides the basic grid search, there also exist other, more advanced hyperparameter tuning routines. For example, sklearn additionally implements a randomized search, and other dedicated libraries provide even fancier approaches, such as Bayesian optimization.
from sklearn.model_selection import GridSearchCV, RandomizedSearchCV
