Data & Concept Drifts
We must never forget that the world keeps on changing and that models need to be updated regularly with new data to be able to adapt to these changing circumstances!
|
ML fails silently! I.e., even if all predictions are wrong, the program does not simply crash with some error message. → Need constant monitoring to detect changes that lead to a deteriorating performance! |
One of the biggest problems in practice: Data and Concept Drifts:
The model performance quickly decays when the distribution of the data used for training \(P_{train}(X, y)\) is different from the data the model encounters when deployed in production \(P_{prod}(X, y)\), where \(P(X, y) = P(y|X)P(X) = P(X|y)P(y)\).
Such a discrepancy can be due to
-
Data drift: the distribution of one or more variables changes. This is called a covariate shift if the distribution of input features \(X\) changes, i.e., \(P_{train}(X) \neq P_{prod}(X)\), and a label shift if the distribution of the target variable \(y\) changes.
-
Concept drift: input/output relationship \(X \to y\) changes, i.e., \(P_{train}(y|X) \neq P_{prod}(y|X)\). This means with exactly the same inputs \(X\) we now get a different output \(y\) than before the drift.
In both cases, something important for our machine learning task changes in the world. If our collected data reflects this change, it is called data drift. If we can’t see this change in our input data, we’re dealing with a concept drift.
Example: From the production settings incl. the size of a produced part (\(X\)) we want to predict whether the part is scrap or okay (\(y\)):
-
Data drift: The company used to manufacture only small parts, now they also produce larger parts.
-
Concept drift: The company used to produce 10% scrap parts, but after some maintenance on the machine, the same production settings (\(X\)) now result in only 5% scrap (\(y\)).
| Covariate shifts, without concept drift, can lead to label shifts when the input variable is causally related to the target. For example, a model predicting cancer (\(y\)) in patients based on age (\(x\)) was trained on a dataset consisting of mostly older people, who naturally also have a higher cancer incidence. In production, the model is used on patients of all ages (covariate shift), i.e., including more young people that have cancer less frequently (label shift). |
Drift Origins & Mitigation Strategies
There are various reasons for data and concepts drifts, both related to how the data is collected as well as external events outside our control.
| These drifts can either be gradual (e.g., languages change gradually as new words are coined; a camera lens gets covered with dust over time), or they can come as a sudden shock (e.g., someone cleans the camera lens; when the COVID-19 pandemic hit, suddenly a lot of people switched to online shopping, which tripped up the credit card fraud detection systems). |
- Changed data schema:
-
Many problems are created in-house and could be avoided, for example
-
the user interface used to collect the data changes, e.g., a height was previously recorded in meters, now in cm
-
the sensor configuration changed, e.g., in a new version of a device, a different sensor is used, but still logs values under the same variable name as the old sensor
-
the features used as input for the model are changed, e.g., to include additional engineered features, but the feature transformation pipeline was only changed in the training code, not yet in the production code.
⇒ These cases should ideally result in an error, e.g., we could include some checks before applying the model to make sure we received the expected number of features, their data types (e.g., text or numbers) is as expected, and the values are roughly in the expected range for the respective feature. Furthermore, other teams in the company need to be made aware that an ML model is relying on their data so they can notify the data science team ahead of time in case of changes.
-
- Data drifts:
-
Data drifts occur when our model has to make predictions for samples that are different from the data it encountered during training, e.g., because certain regimes of the training domain were undersampled, or in the extreme case the model might even be forced to extrapolate beyond the training domain, for example, due to
-
changed sample selection, e.g., the business recently expanded to a different country or after a targeted marketing campaign the website is now visited by a new user group
-
adversarial behavior, e.g., spammers continuously adapt their messages in an effort to circumvent spam filters (i.e., ten years ago a human would have also recognized a spam message from today as spam (i.e., the meaning of what is or isn’t spam didn’t change), but these more sophisticated messages weren’t included in the training set yet, making it hard for ML models to pick up on these patterns)
⇒ Data drifts can be seen as an opportunity to extend our training set and retrain the model with more data from underrepresented subgroups. Yet, as highlighted in the earlier section on model-based discrimination, this often implies that these undersampled subgroups could initially experience a less effective model, such as a speech recognition function performing less accurately for women than for men. Therefore, it’s crucial to identify subgroups where the model might exhibit poor performance, ideally gathering more data from these groups or, at the very least, giving greater consideration to these samples during model training and evaluation.
-
- Concept drifts:
-
Concept drifts happen when external changes or events occur that we did not record in our data or that change the meaning of our data. This means that the exact same input features suddenly result in a different output. One reason can be that we’re missing a variable that has a direct influence on the target, for example
-
our process is sensitive to temperature and humidity, but we only recorded the temperature not the humidity, so as the humidity changes, the same temperature values result in different output values ⇒ additionally include humidity as an input feature in the model
-
seasonal trends result in changes in the popularity of summer vs. winder clothes ⇒ include month / outside temperature as an additional input feature
-
special events, e.g., a celebrity mentioned our product on social media or people changed their behavior because of the lockdown during a pandemic ⇒ while it can be hard to predict these events in advance, when they happen we could include an additional feature, e.g., ‘during lockdown’, to distinguish data collected during this time period from the rest of the data
-
degenerate feedback loops, i.e., the existence of the model changes users' behavior, e.g., a recommender system causes users to click on videos just because they were recommended ⇒ include as an additional feature whether the video was recommended or not to learn how much of “user clicked on item” was due to the item being recommended and how much was due to the user’s natural behavior
Another cause of concept drifts are events that change the meaning of the recorded data, for example
-
inflation: 1 Euro in 1990 was worth more than 1 Euro now ⇒ adjust the data for inflation or include the inflation rate as an additional input feature
-
a temperature sensor immersed in water amasses limescale and after a while the temperature reading is not accurate anymore, e.g., if the true temperature is 90 degrees, a clean senor measures the true 90 degrees, but after it has accumulated some layers of limescale, it only measures 89 degrees under the same circumstances. While our output is influenced by the true temperature, we only have access to the sensor reading for the temperature, which is additionally influenced by the state of the sensor itself ⇒ try to estimate the amount of accumulated limescale, e.g., based on the number of days since the sensor was cleaned the last time (which also means that these kinds of maintenance events need to be recorded somewhere!)
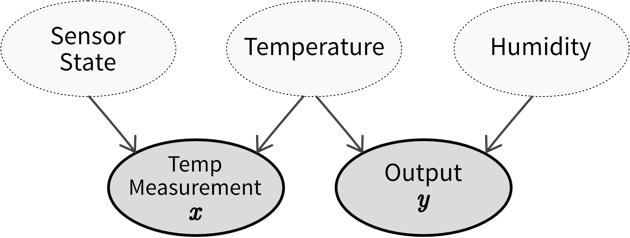 Causal diagram showing how our observed input \(x\) (temperature measurement) and output \(y\) are related through and influenced by hidden variables (which we can not access directly), namely, the state of the temperature sensor (i.e., how much limescale has accumulated), the actual temperature, and the humidity (for which we have not installed a sensor yet). If the sensor state and humidity stay constant, we are able to predict the output from the temperature measurement, however, if either of these values change, we experience a concept drift. Therefore, we should try to include estimates of these hidden variables in our model to account for these changes.
⇒ Before training a model, examine the data to identify instances where identical inputs yield different outputs. If possible, include additional input features to account for these variations. Subpar model performance on the test set often indicates missing relevant inputs, heightening vulnerability to future concept drifts. Even when the correct variables are incorporated to capture a concept drift, frequent model retraining may still be necessary. For instance, different states of the concept might be sampled unevenly, leading to data drifts (e.g., more data collected during winter than in the early summer months). If it is not possible to include variables that account for the concept drift, it might be necessary to remove samples from the original training set that do not conform to the novel input/output relation before retraining the model.
-
| The best way to counteract data and concept drifts is to frequently retrain the model on new data. This can either happen on a schedule (e.g., every weekend, depending on how quickly the data changes) or when your monitoring system raises an alert because it detected drifts in the inputs or a deteriorating model performance. |
While traditional ML models typically need to be retrained from scratch, neural network models can also be fine-tuned on newly collected data, however, this is only useful when faced with minor data drifts, not drastic concept drifts.
To get a better understanding of how often it might be necessary to retrain the model, we can train the model on data from different periods in the past and then compare the performance on the most recent data (e.g., train the model on data from Jan-June, April-Sept, and June-Nov and then compare the performances on the data from December — if the model trained on the most recent data performs much better, it probably makes sense to retrain the model more frequently). Of course, in the presence of sudden events, it might be necessary to train the model outside of the regular schedule.
| The "ML fails silently" part also applies to bugs in your code: Especially when you just started with ML it often happens that your results seem fine (maybe just a little too good), but you have a subtle bug somewhere that doesn’t cause your program to crash, but just calculates something slightly wrong somewhere. These issues can be very hard to notice, so always triple-check your code and if you can, write unit tests for individual functions to make sure they do what you expect them to do. |
| You might also want to have a look at Google’s rules of machine learning (the first one being: "Don’t be afraid to launch a product without machine learning.") |