Model discriminates
As we ponder the true causal relations between variables in the data, we also need to consider whether there are some causal relationships encoded in the historical data that we don’t want a model to pick up on. For example, discrimination based on gender or ethnicity can leak into the training data and we need to take extra measures to make sure that these patterns, although they might have been true causal relationships in the past, are not present in our model now.
- Biased data leads to (strongly) biased models
-
Below are some examples where people with the best of intentions have set up an ML model that has learned problematic things from real world data.

de Vries, Terrance, et al. “Does object recognition work for everyone?” IEEE/CVF Conference on Computer Vision and Pattern Recognition Workshops. 2019.
The above problems all arose because the data was not sampled uniformly:
-
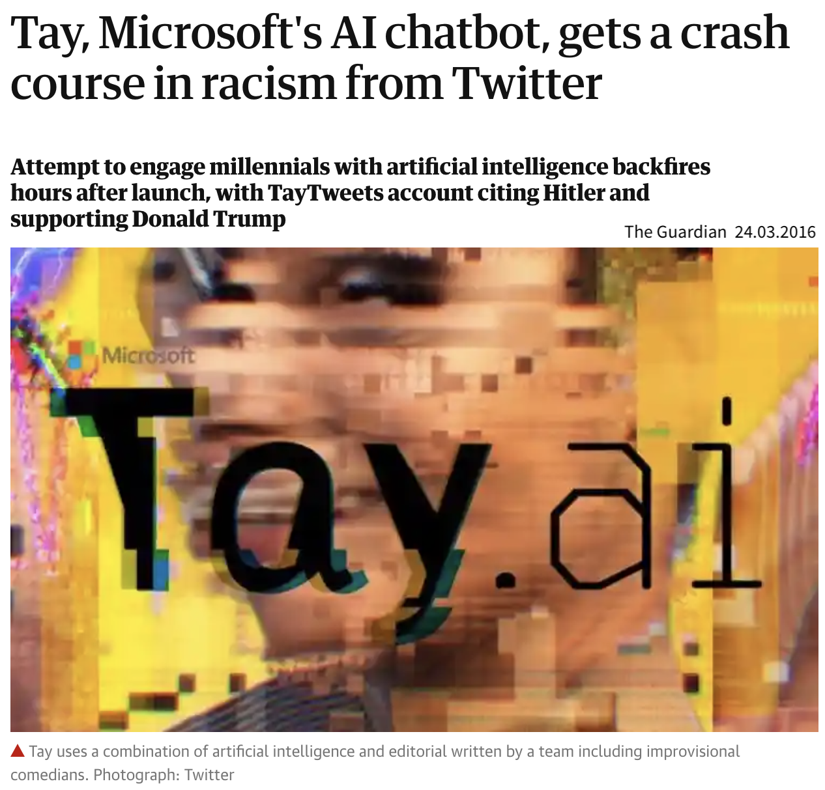
Tay has seen many more racist and hateful comments and tweets than ‘normal’ ones.
-
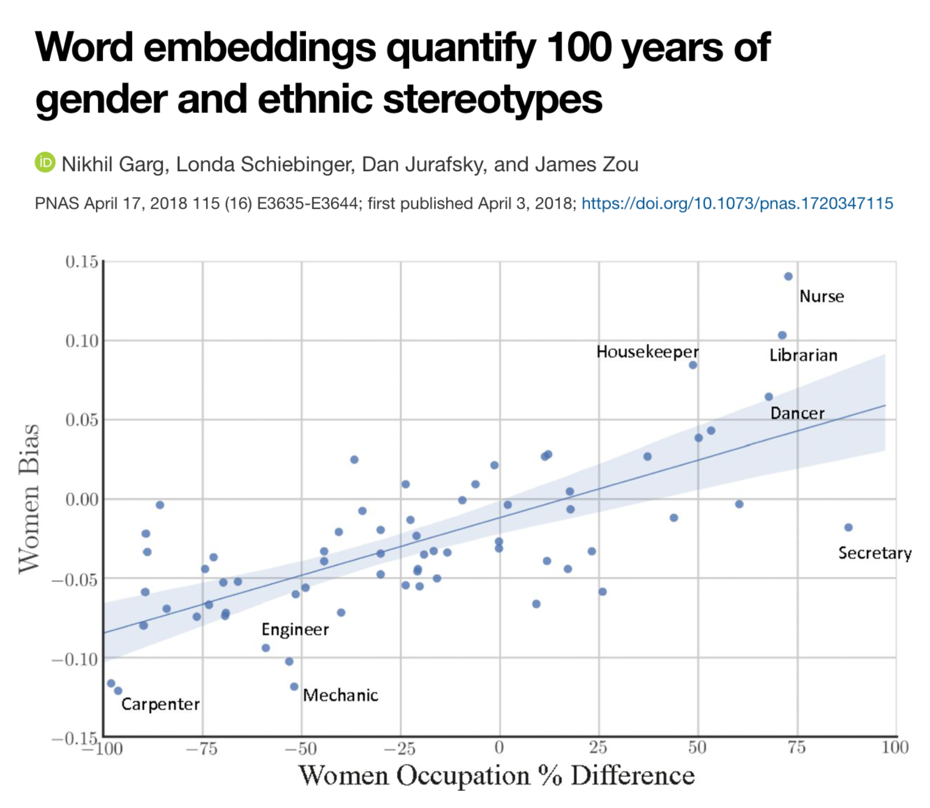
In historical texts, women were underrepresented in professions such as doctors, engineers, carpenters, etc.
-
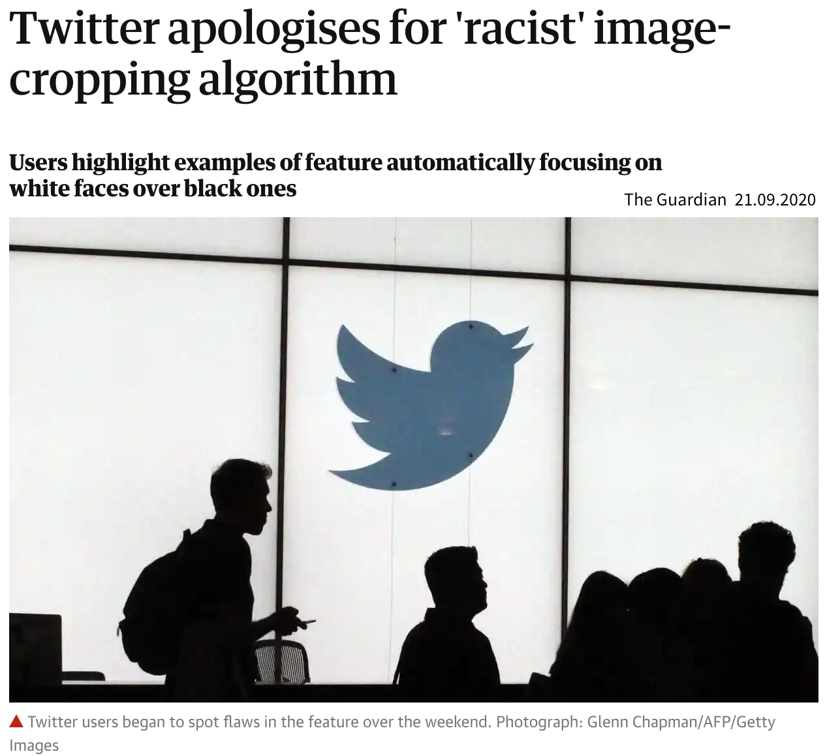
The image dataset Twitter trained its model on included more pictures of white people compared to people of color.
-
Similarly, given a random collection of photos from the internet, these images will have mostly been uploaded by people from developed countries, i.e., pictures displaying the status quo in developing nations are underrepresented.
Even more problematic than a mere underrepresentation of certain subgroups (i.e., a skewed input distribution) is a pattern of systematic discrimination against them in historical data (i.e., a discriminatory shift in the assigned labels).
To summarize: A biased model can negatively affect users in two ways:
-
Disproportionate product failures, due to skewed sampling. For example, speech recognition models are often less accurate for women, because they were trained on more data collected from men (e.g., transcribed political speeches).
-
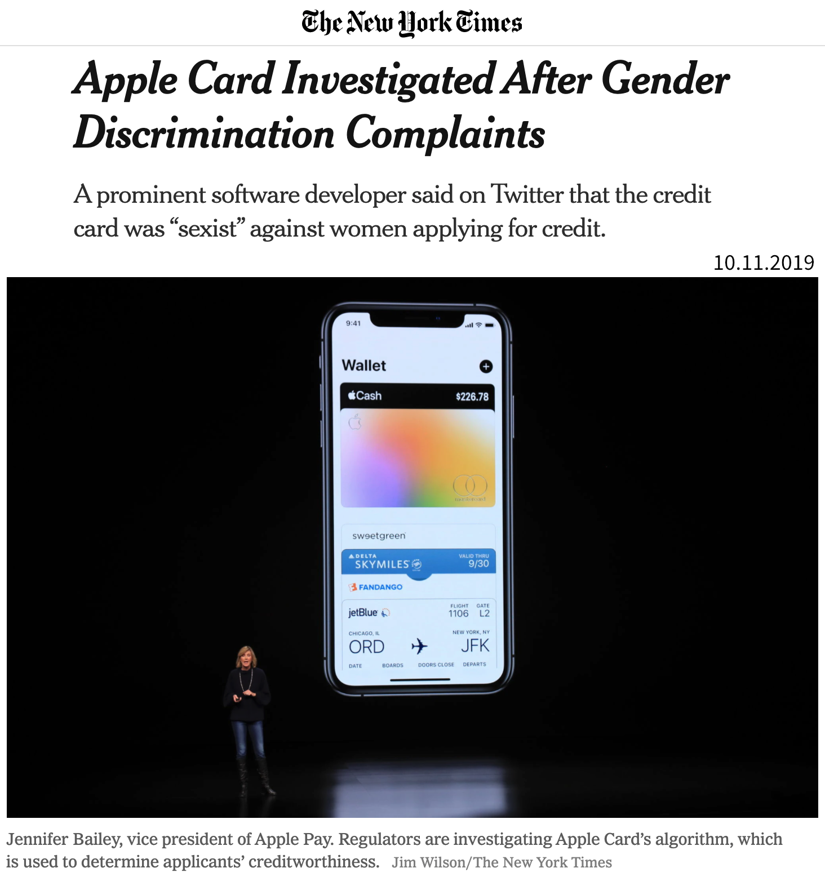
Harm by disadvantage / opportunity denial, due to stereotypes encoded in historical data. For example, women are assigned higher credit interest rates than men or people born in foreign countries are deemed less qualified for a job when their resumes are assessed by an automated screening tool.
| Retraining models on data shaped by predictions from a biased predecessor model can intensify existing biases. For instance, if a resume screening tool recognizes a common trait (e.g., “attended Stanford University”) among current employees, it may consistently recommend resumes with this trait. Consequently, more individuals with this characteristic will be invited for interviews and hired, further reinforcing the dominance of the trait in subsequent models trained on these employee profiles. |
Towards fair models
1.) Know you have a problem
The first step to mitigating these problems is to become aware of them. We often don’t notice a poor performance for an undersampled subgroup, because the model performance overall looks fine:
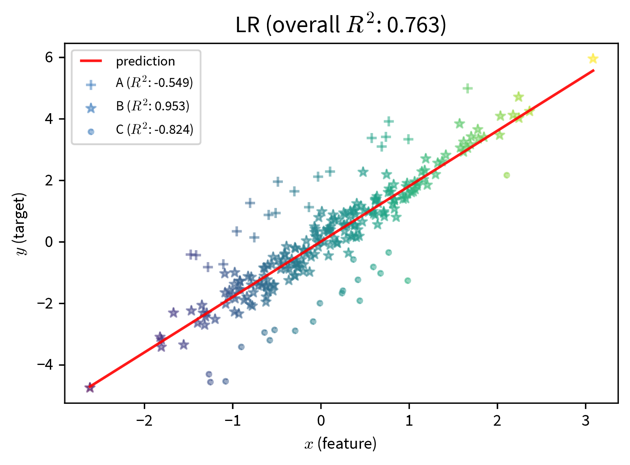
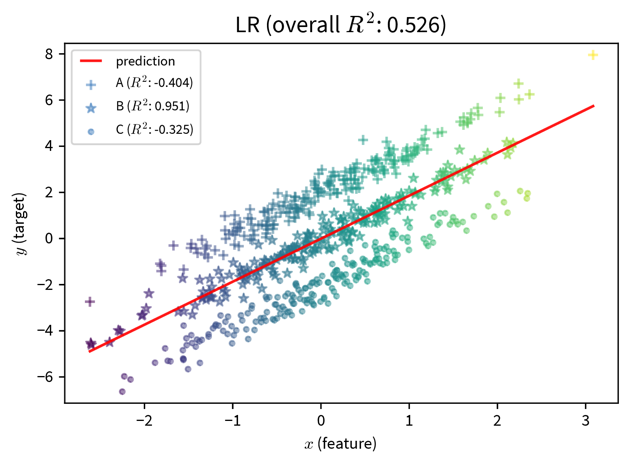
These two plots show a simple linear regression model trained on data with three subgroups (e.g., subgroups could be based on gender and/or ethnicity). In both cases, the model performs well for the subgroup in the middle, but poorly for the marginalized subgroups. However, if we only consider at the overall \(R^2\) value of the model, the performance of the model on the left seems fine, since here the good performance on the ‘main’ subgroup drowns out the poor performance on the undersampled marginalized subgroups. The poor performance of the model is only apparent when the subgroups are sampled equally.
Therefore:
-
Assess the model’s performance for each (known) subgroup individually by slicing the data accordingly to verify that the prediction errors of the model are random and the model is not systematically worse for some subgroups / data slices.
-
If it is not possible to obtain a well balanced training and/or test set, assign higher sample weights to data points from undersampled subgroups to make sure the algorithm pays enough attention to them during training and they are given more weight when evaluating the model (similar to using the balanced accuracy).
-
Check if/how the model’s prediction changes when everything about a data point is the same except attributes encoding gender / age / ethnicity / etc.
-
Interpret the model to see whether features encoding subgroup-specific information have an unexpectedly high influence on the prediction.
2.) Learn a fair model
We should also be careful when including variables in the model that encode attributes such as gender or ethnicity. For example, the performance of a model that diagnoses heart attacks will most likely be improved by including ‘gender’ as a feature, since men and women present different symptoms when they have a heart attack. On the other hand, a model that assigns someone a credit score should probably not rely on the gender of the person for this decision, since, even though this might have been the case in the historical data because the humans that generated the data relied on their own stereotypes, women should not get a lower score just because they are female.
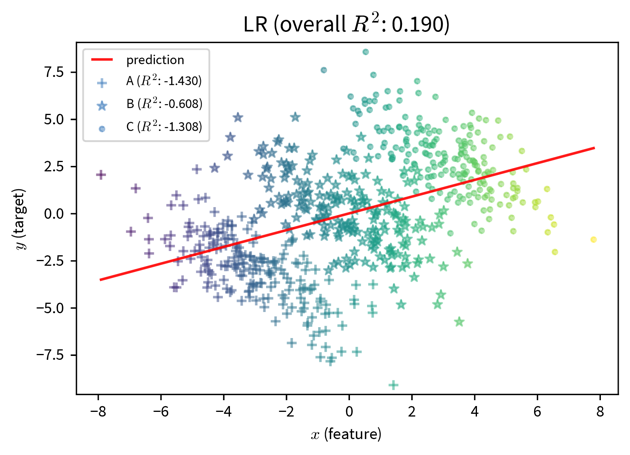
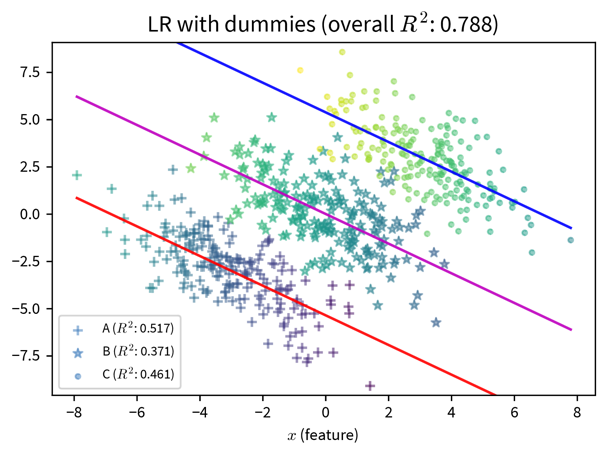
In the plot on the right, additional dummy variables to represent the different subgroups in the data are included in the model and improve its predictive performance. While this can make the bias of a model explicit, should this information be included at all? (By the way, this is also an example of Simpson’s paradox, where the model’s coefficients reverse their sign when additional features are included.)
However, a person’s gender or ethnicity, for example, is often correlated with other variables such as income or neighborhood, so even inconspicuous features can still leak problematic information to the model and require some extra steps to ensure the model does not discriminate.
This can, for example, be achieved by setting up a neural network that learns subgroup-invariant feature representations:
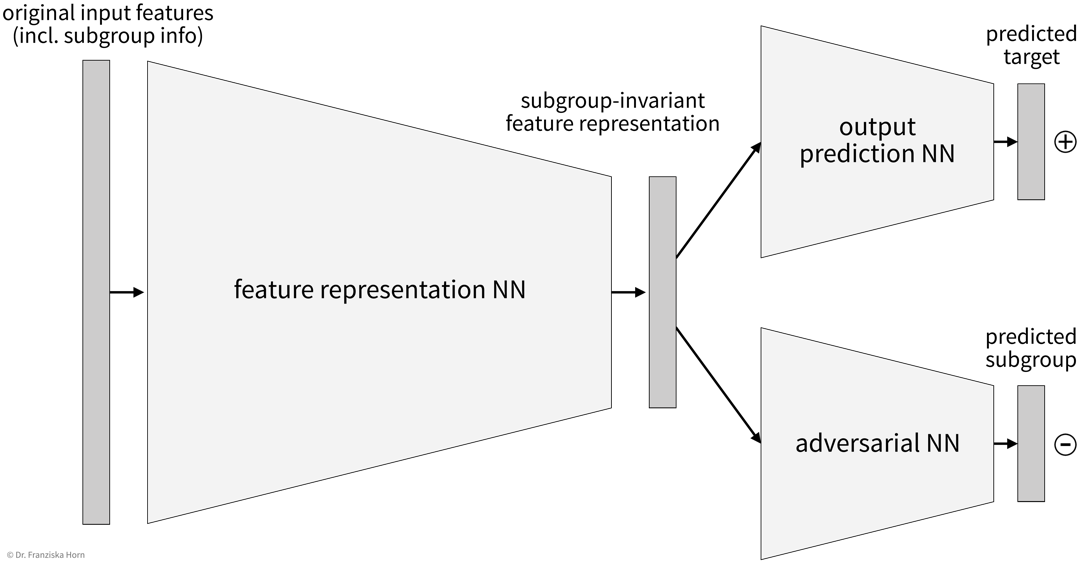
This architecture works similar to a Generative Adversarial Network (GAN) in that there are two parts of the network, one that tries to predict the target from the intermediate feature representation and the other (i.e., the adversary) that tries to predict the subgroup label (e.g., gender) from the same representation. The goal here is to find an intermediate feature representation that still includes all the necessary information such that the first network can predict the target, but from which the adversarial network can not predict the subgroup anymore, which can be achieved by training both networks together.
For other examples of what not to do, check out the AI Incidence Database and
Book recommendation:
Weapons of Math Destruction by Cathy O’Neil (2016)