Data is the new oil!?
Let’s take a step back. Because it all begins with data.
You’ve probably heard this claim before: “Data is the new oil!”. This suggests that data is valuable. But is it?
The reason why oil is considered valuable is because we have important use cases for it: powering our cars, heating our homes, and producing plastics or fertilizers.
Similarly, our data is only as valuable as what we make of it. So what can we use data for?
The main use cases belong to one of two categories:
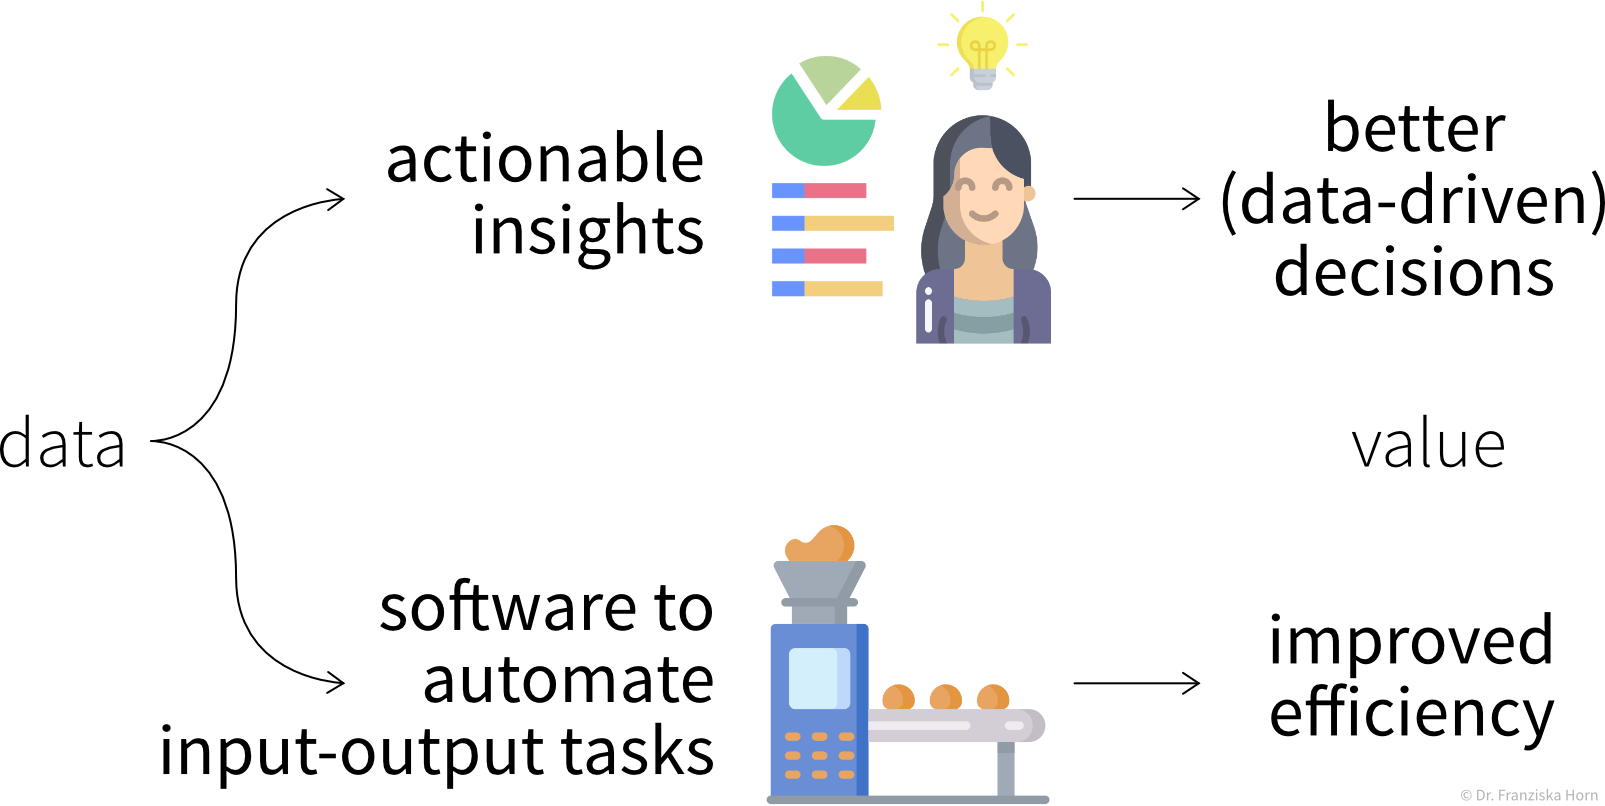
Insights
We can generate insights either through continuous monitoring (“Are we on track?”) or a deeper analysis (“What’s wrong?”).
By visualizing important variables or Key Performance Indicators (KPIs) in reports or dashboards, we increase transparency of the status quo and quantify our progress towards some goal. When a KPI is far from its target value, we can dig deeper into the data with an exploratory data analysis to identify the root cause of the problem and answer questions such as
-
Why are we not reaching our goal?
-
What should we do next?
However, as we’ll discuss in more detail in the section on data analysis, arriving at satisfactory answers is often more art than science 😉.
Automation
As described in the following sections, machine learning models can be used to automate ‘input → output’ tasks otherwise requiring a human (expert). These tasks are usually easy for an (appropriately trained) human, for example:
-
Translating texts from one language into another
-
Sorting out products with scratches when they pass a checkpoint on the assembly line
-
Recommending movies to a friend
For this to work, the ML models need to be trained on a lot of historical data (e.g., texts in both languages, images of products with and without scratches, information about different users and which movies they watched).
The resulting software can then either be used to automate the task completely or we can keep a human in the loop that can intervene and correct the suggestions made by the model.