How do machines “learn”?
How do ML algorithms solve these “input → output” problems, i.e., how do they recognize patterns and learn rules from data?
The set of ML algorithms can be subdivided according to their learning strategy. This is inspired by how humans learn:

Analogously, machines can also learn by following these three strategies:
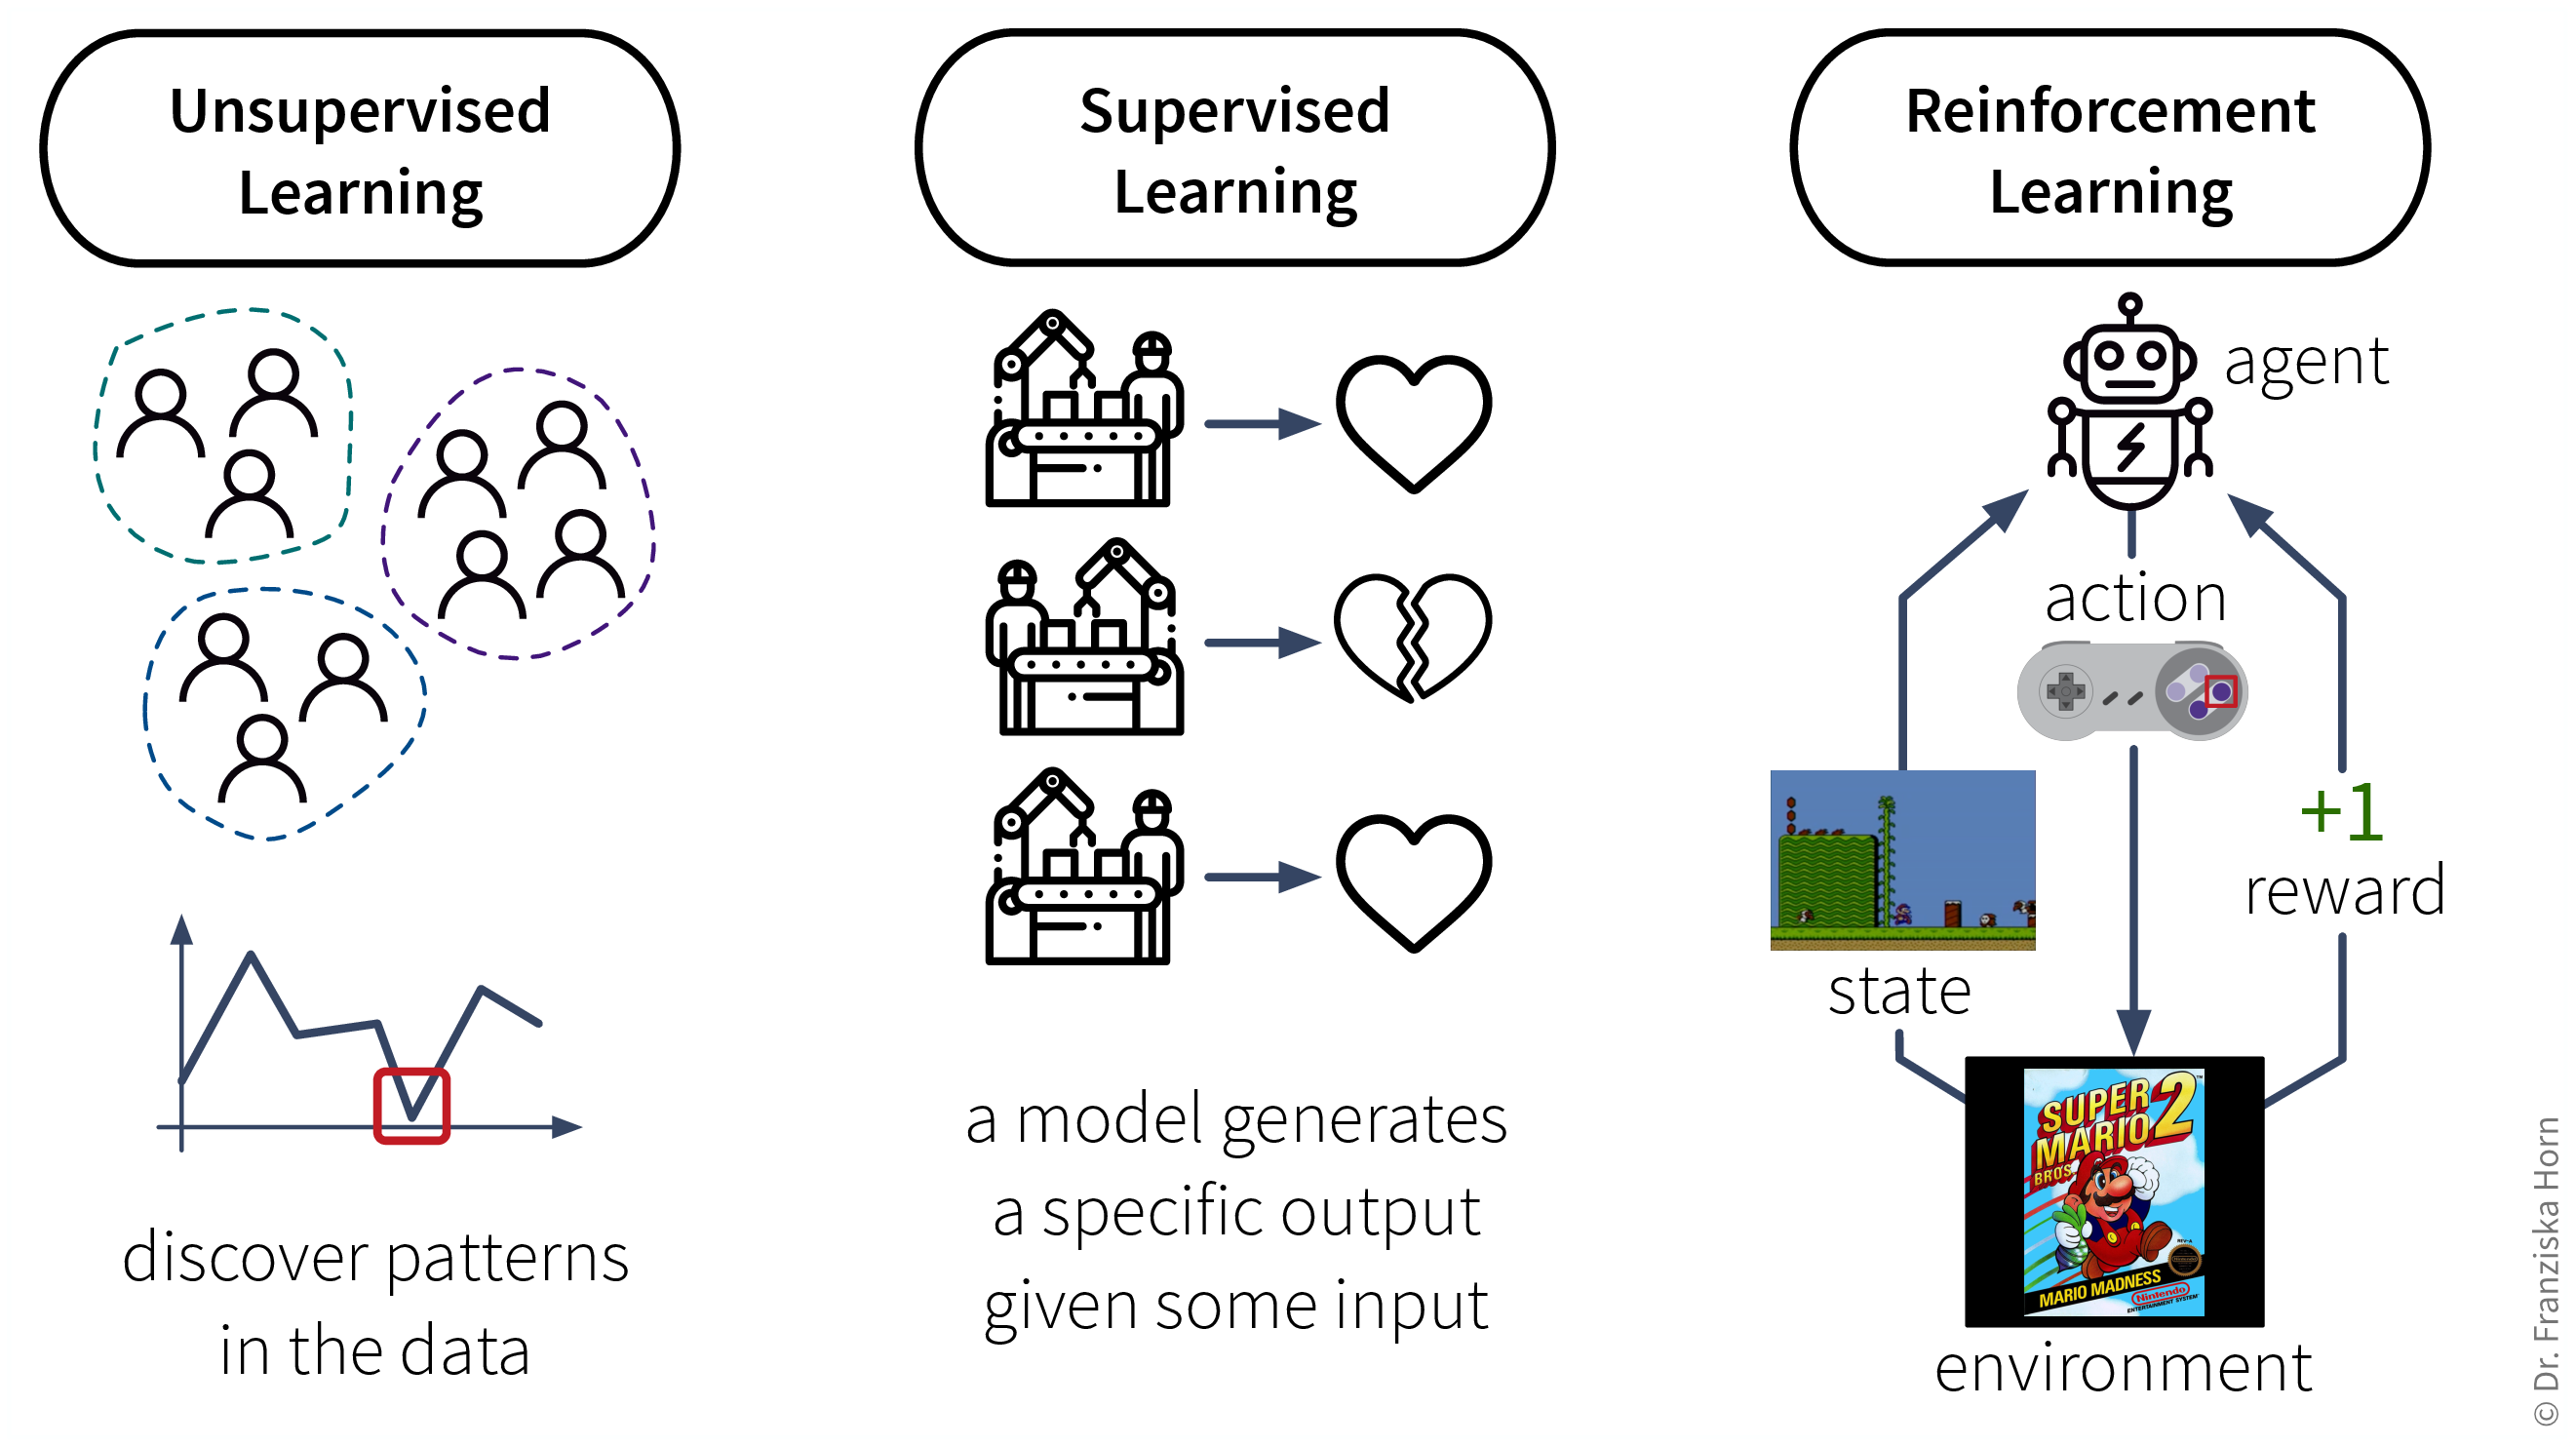
- Data requirements for learning according to these strategies:
-
-
Unsupervised Learning: a dataset with examples

-
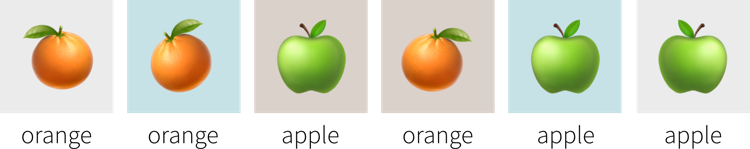
Supervised Learning: a dataset with labeled examples
-
Reinforcement Learning: a (simulation) environment that generates data (i.e., reward + new state) in response to the agent’s actions

With its reliance on a data-generating environment, reinforcement learning is a bit of a special case. Furthermore, as of now it’s still really hard to get reinforcement learning algorithms to work correctly, which means they’re currently mostly used in research and not so much for practical applications.
-
Supervised Learning
Supervised learning is the most common type of machine learning used in today’s applications.
The goal here is to learn a model (= a mathematical function) \(f(x)\) that describes the relationship between some input(s) \(x\) (e.g., different process conditions like temperature, type of material, etc.) and output \(y\) (e.g., resulting product quality).
This model can then be used to make predictions for new data points, i.e., compute \(f(x') = y'\) for some new \(x'\) (e.g., predict for a new set of process conditions whether the produced product will be of high quality or if the process should be stopped to not waste resources).
- Supervised Learning in a nutshell:
-
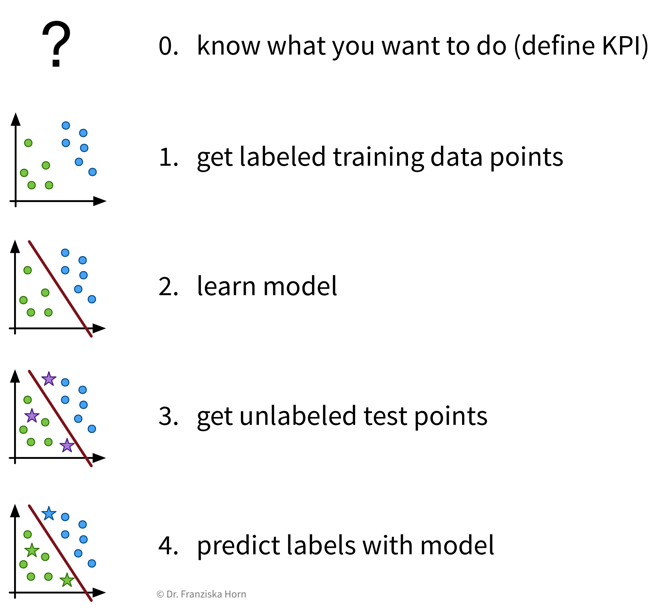 Before we start, we need to be very clear on what we want, i.e., what should be predicted, how will predicting this variable help us achieve our overall goals and create value, and how do we measure success, i.e., what is the Key Performance Indicator (KPI) of our process. Then, we need to collect data — and since we’re using supervised learning, this needs to be labeled data, with the labels corresponding to the target variable that we want to predict. Next, we “learn” (or “train” or “fit”) a model on this data and finally use it to generate predictions for new data points.
Features & Labels
A production process, where we want to predict whether a produced part is scrap given certain production conditions, is an example of a typical supervised learning problem. Here, the collected data for each produced part includes the process conditions under which it was produced, as well as the outcome, i.e., whether the product was okay or scrap:
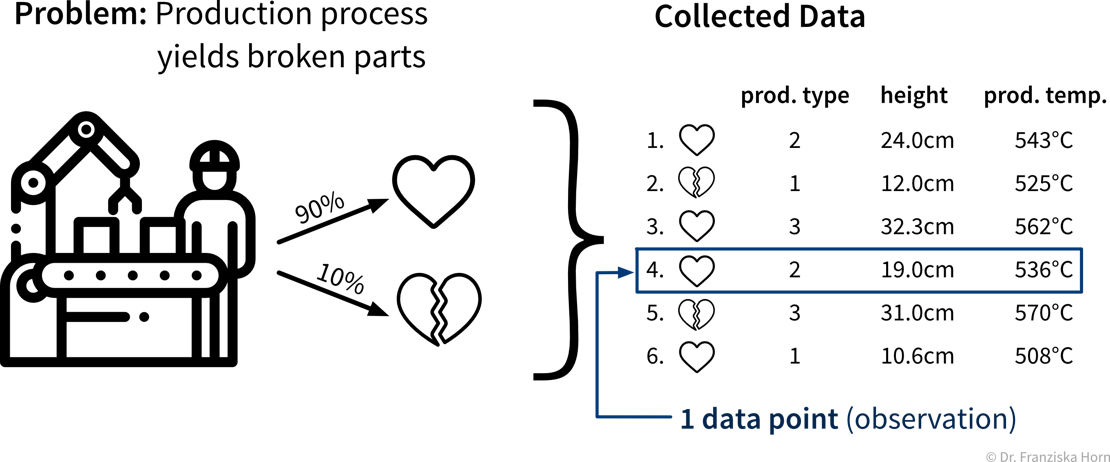
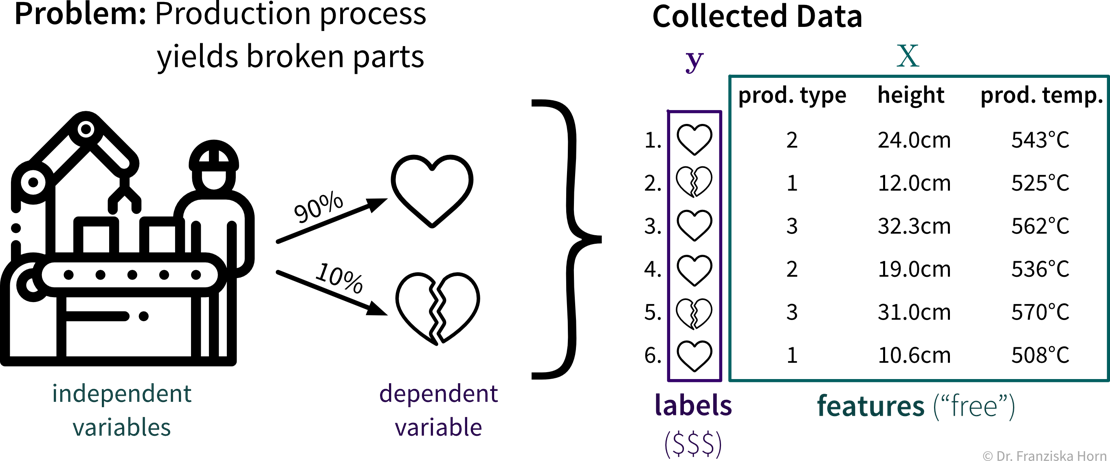
In the supervised learning setup, the features are used as the input to the model, while the labels constitute the target variable, i.e., the predicted output. Generally, features should be independent variables (e.g., settings that the operator can choose as he wishes), while the target value should be dependent on these inputs — otherwise we can’t predict it from these inputs alone.
“Learning” a model from the data
Goal: Describe the relationship between input(s) \(x\) and output \(y\) with a model, i.e., a mathematical function \(f(x)\)
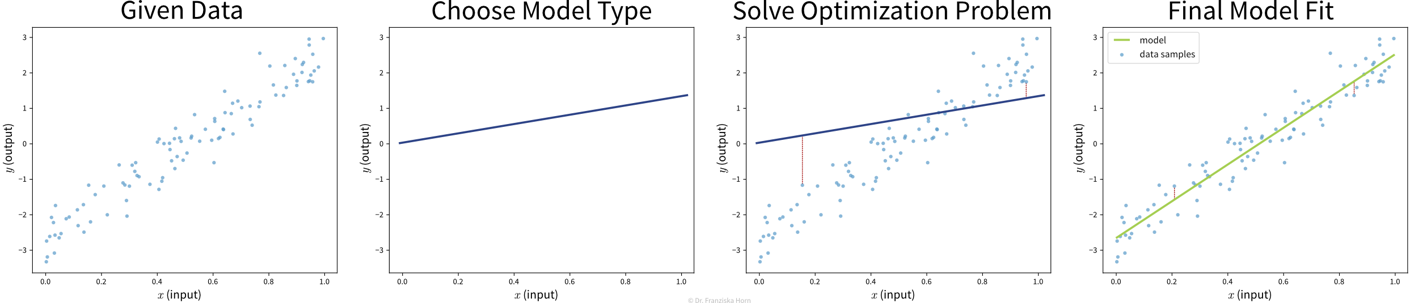
-
Select a model class (= structure of the function): Assumption: relationship is linear
→ linear regression model: \(y = f(x) = b + w\cdot x\) -
Define an objective: Minimize error between true & predicted \(y\):
→ \(\min_{b,w} \sum_i (y_i - f(x_i))^2\) -
Find best model parameters given the data: i.e., solve the optimization problem defined in step 2
⇒ \(f(x) = -2.7 + 5.2x\)
| Video Recommendation: If you’re not familiar with linear regression, the most basic supervised learning algorithm, please watch the explanation from Google decision scientist Cassie Kozyrkov on how linear regression works: [Part 1] [Part 2] [Part 3] |
The available supervised learning algorithms differ in the type of \(x \to y\) relationship they can describe (e.g., linear or nonlinear) and what kind of objective they minimize (also called loss function; an error computed on the training data, quantifying the mismatch between true and predicted labels). The task of a data scientist is to select a type of model that can optimally fit the given data. The rest is then taken care of by an optimization method, which finds the parameters of the model that minimize the model’s objective, i.e., such that the model’s prediction error on the given data is as small as possible.
| In most of the book, the terms “ML algorithm” and “ML model” will be used interchangeably. To be more precise, however, in general the algorithm processes the data and learns some parameter values. These parameter settings define the final model. For example, a linear regression model is defined by its coefficients (i.e., the model’s parameters), which are found by executing the steps outlined in the linear regression algorithm, which includes solving an optimization problem. |
Don’t stop there!
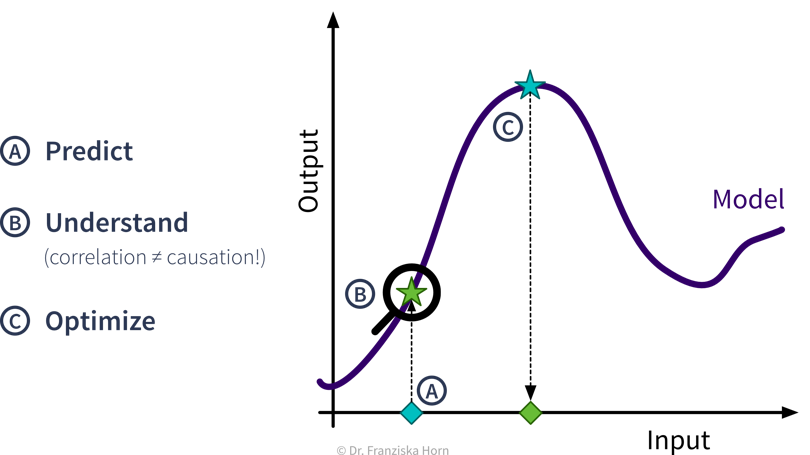
- Predictive Analytics
-
By feeding historical data to a supervised learning algorithm, we can generate a predictive model that makes predictions about future scenarios to aid with planning.
Example: Use sales forecasts to better plan inventory levels. - Interpreting Predictive Models
-
Given a model that makes accurate predictions for new data points, we can interpret this model and explain its predictions to understand root causes in a process.
Example: Given a model that predicts the quality of a product from the process conditions, identify which conditions result in lower quality products. - What-if Analysis & Optimization
-
Given a model that makes accurate predictions for new data points, we can use this model in a “what-if” forecast to explore how a system might react to different conditions to make better decisions (but use with caution!).
Example: Given a model that predicts the remaining lifetime of a machine component under some process conditions, simulate how quickly this component would deteriorate if we changed the process conditions.Going one step further, this model can also be used inside an optimization loop to automatically evaluate different inputs with the model systematically to find optimal settings.
Example: Given a model that predicts the quality of a product from the process conditions, automatically determine the best production settings for a new type of raw material.