ML use cases
The inputs that the ML algorithms operate on can come in many forms…
- Structured vs. unstructured data
-
Data can come in various forms and while some data types require additional preprocessing steps, in principle ML algorithms can be used with all kinds of data.
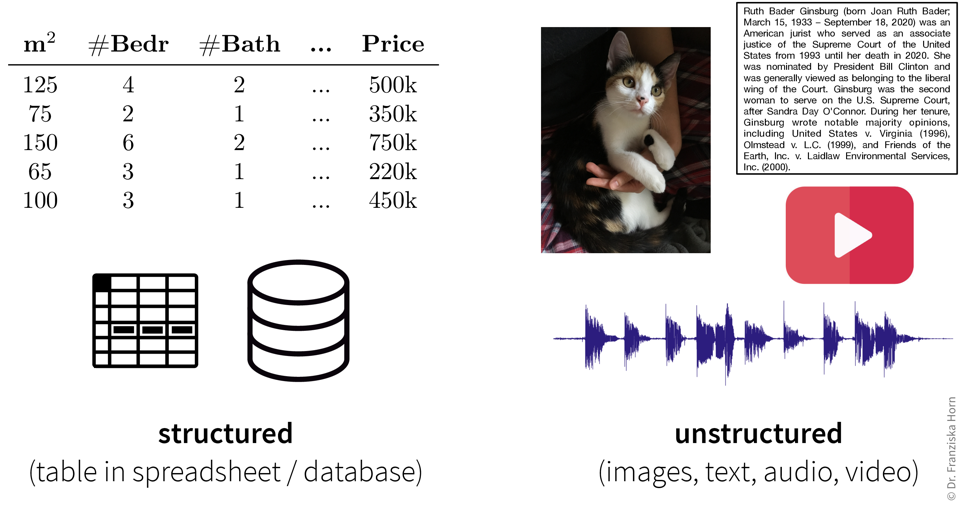 The main distinction when characterizing data is made between structured data, which is any dataset that contains individual measurements / variables / attributes / features that represent unique quantities, and unstructured data, which can not be subdivided into meaningful variables. For example, in images “first pixel from the left” or in texts “10th word in the second paragraph” is not what we would call a variable, while “size in square meters” and “number of bedrooms” are useful quantities to describe an apartment. Structured data is often heterogeneous, since the different variables in a dataset typically stand for very different things. For example, when working with sensor data, a dataset normally does not consist of only temperature measurements, but additionally it could contain, e.g., pressure and flow values, which have different units and measurement scales. Unstructured data, on the other hand, is homogeneous, e.g., there is no qualitative difference between the 10th and the 100th pixel in an image.
…but our goal, i.e., the desired outputs, determines the type of algorithm we should use for the task:
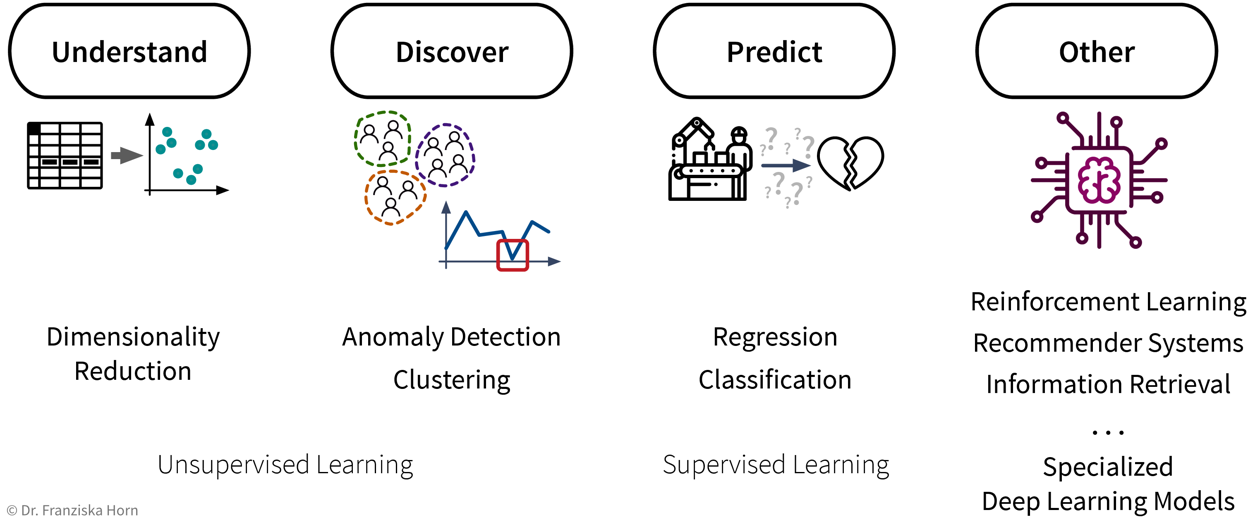
Some example input → output tasks and what type of ML algorithm solves them:
| Input \(X\) | Output \(Y\) | ML Algorithm Category |
|---|---|---|
questionnaire answers |
customer segmentation |
clustering |
sensor measurements |
everything normal? |
anomaly detection |
past usage of a machine |
remaining lifetime |
regression |
spam (yes/no) |
classification (binary) |
|
image |
which animal? |
classification (multi-class) |
user’s purchases |
products to show |
recommender systems |
search query |
relevant documents |
information retrieval |
audio |
text |
speech recognition |
text in English |
text in French |
machine translation |
To summarize (see also: overview table as PDF):
- Existing ML solutions & corresponding output (for one data point):
-
-
Dimensionality Reduction: (usually) 2D coordinates (to create a visualization of the dataset)
-
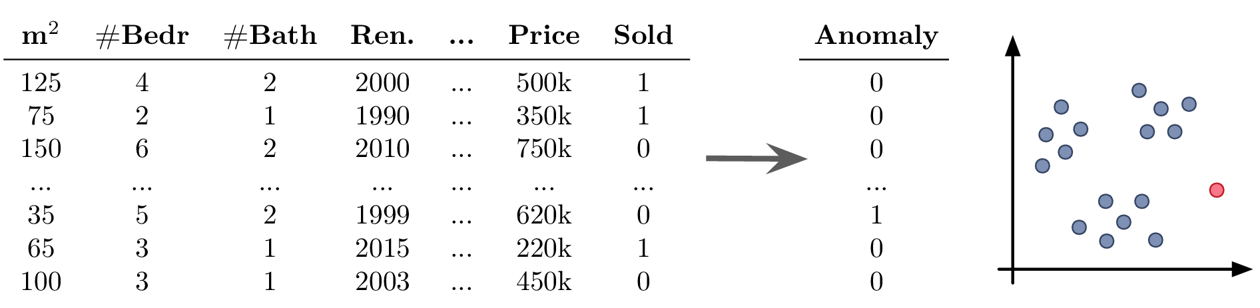
Outlier/Anomaly Detection: anomaly score (usually a value between 0 and 1 indicating how likely it is that this point is an outlier)
-
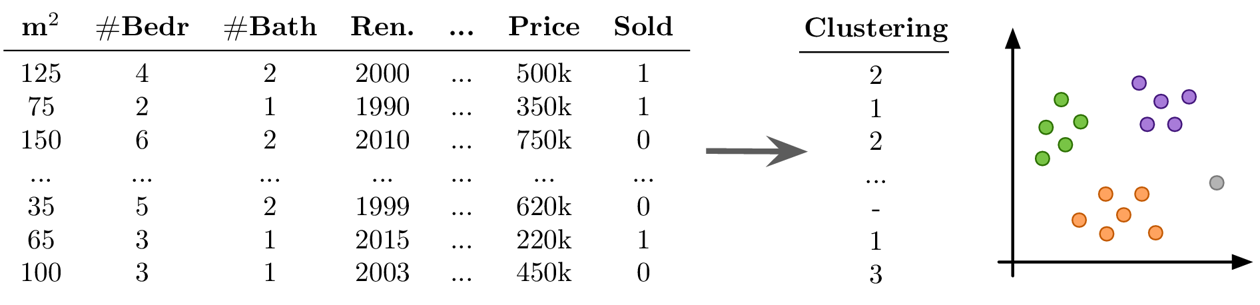
Clustering: cluster index (a number between 0 and k-1 indicating to which of the k clusters a data point belongs (or -1 for outliers))
-
Regression: a continuous value (any kind of numeric quantity that should be predicted)
-
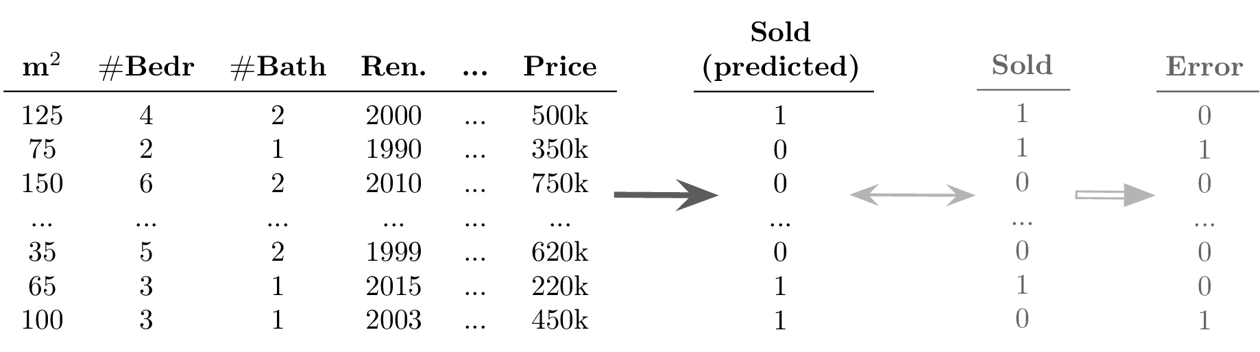
Classification: a discrete value (one of several mutually exclusive categories)
-
Generative AI: unstructured output like a text or image (e.g., speech recognition, machine translation, image generation, or neural style transfer)
-
Recommender Systems & Information Retrieval: ranking of a set of items (recommender systems, for example, rank the products that a specific user might be most interested in; information retrieval systems rank other items based on their similarity to a given query item)
-
Reinforcement Learning: a sequence of actions (specific to the state the agent is in)
-
Let’s start with a more detailed look at the different unsupervised & supervised learning algorithms and what they are good for:
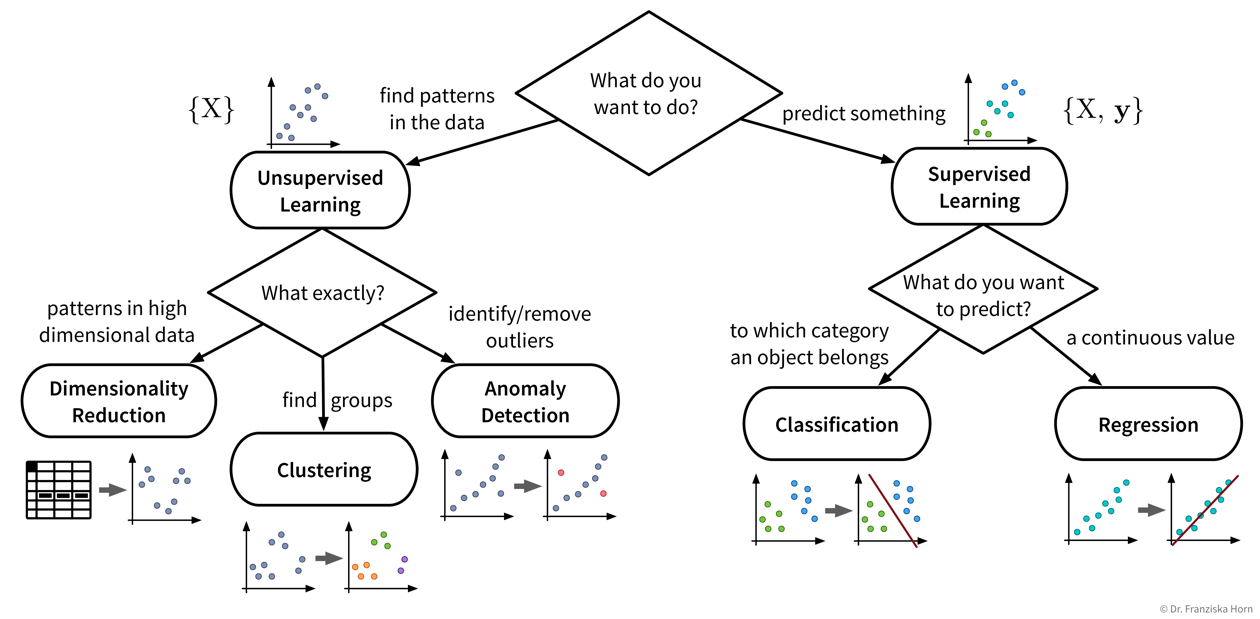
| Even if our ultimate goal is to predict something (i.e., use supervised learning), it can still be helpful to first use unsupervised learning to get a better understanding of the dataset, for example, by visualizing the data with dimensionality reduction methods to see all samples and their diversity at a glance, by identifying outliers to clean the dataset, or, for classification problems, by first clustering the samples to check whether the given class labels match the naturally occurring groups in the data or if, e.g., two very similar classes could be combined to simplify the problem. |
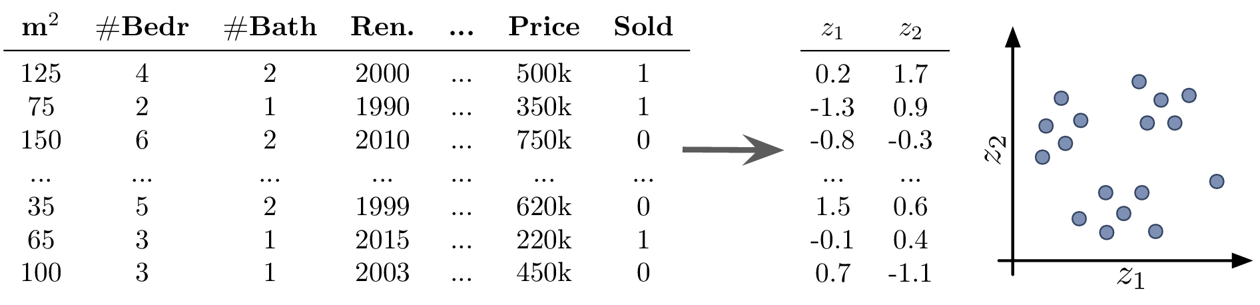
Dimensionality Reduction
-
create a 2D visualization to explore the dataset as a whole, where we can often already visually identify patterns like samples that can be grouped together (clusters) or that don’t belong (outliers)
-
noise reduction and/or feature engineering as a data preprocessing step to improve the performance in the following prediction task
- Example Unsupervised Learning: Dimensionality Reduction
-
Goal: Visualize the dataset
-
transforming the data with dimensionality reduction methods constructs new features as a (non)linear combination of the original features, which decreases the interpretability of the subsequent analysis results
Anomaly Detection
-
clean up the data, e.g., by removing samples with wrongly entered values, as a data preprocessing step to improve the performance in the following prediction task
-
create alerts for anomalies, for example:
-
fraud detection: identify fraudulent credit card transaction in e-commerce
-
monitor a machine to see when something out of the ordinary happens or the machine might require maintenance
-
- Example Unsupervised Learning: Anomaly Detection
-
Goal: Find outliers in the dataset
-
you should always have a good reason for throwing away data points — outliers are seldom random, sometimes they reveal interesting edge cases that should not be ignored
Clustering
-
identify groups of related data points, for example:
-
customer segmentation for targeted marketing campaign
-
- Example Unsupervised Learning: Clustering
-
Goal: Find naturally occurring groups in the dataset
-
no ground truth: difficult to choose between different models and parameter settings → the algorithms will always find something, but whether this is useful (i.e., what the identified patterns mean) can only be determined by a human in a post-processing step
-
many of the algorithms rely on similarities or distances between data points, and it can be difficult to define an appropriate measure for this or know in advance which features should be compared (e.g., what makes two customers similar?)
Unsupervised learning has no ground truth
It is important to keep in mind that unsupervised learning problems have no right or wrong answers. Unsupervised learning algorithms simply recognize patterns in the data, which may or may not be meaningful for us humans.
For example, there exist a bunch of different unsupervised learning algorithms that group data points into clusters, each with a slightly different strategy and definition of what it means for two samples to be similar enough that they can be put into the same cluster.
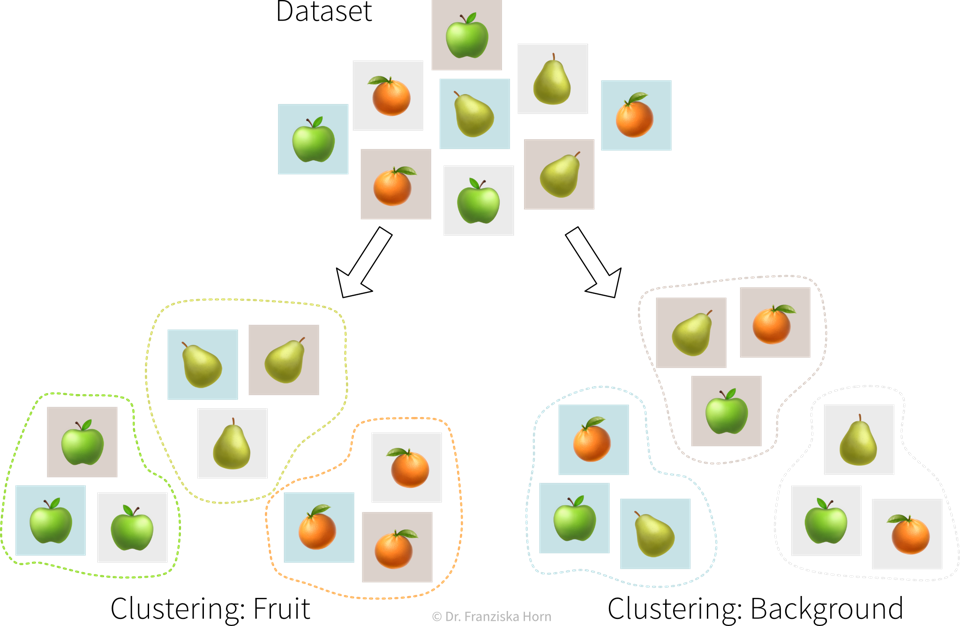
It is up to the data scientist to examine the results of an unsupervised learning algorithm and make sense of them. And if they don’t match our expectations, we can simply try a different algorithm.
Regression & Classification
-
Learn a model to describe an input-output relationship and make predictions for new data points, for example:
-
predict in advance whether a product produced under the proposed process conditions will be of high quality or would be a waste of resources
-
churn prediction: identify customers that are about to cancel their contract (or employees that are about to quit) so you can reach out to them and convince them to stay
-
price optimization: determine the optimal price for a product (often used for dynamic pricing, e.g., to adapt prices based on the device a customer uses (e.g., new iPhone vs old Android phone) when accessing a website)
-
predictive maintenance: predict how long a machine component will last
-
sales forecasts: predict revenue in the coming weeks and how much inventory will be required to satisfy the demand
-
- Example Supervised Learning: Classification
-
Goal: Predict a discrete value for each data point
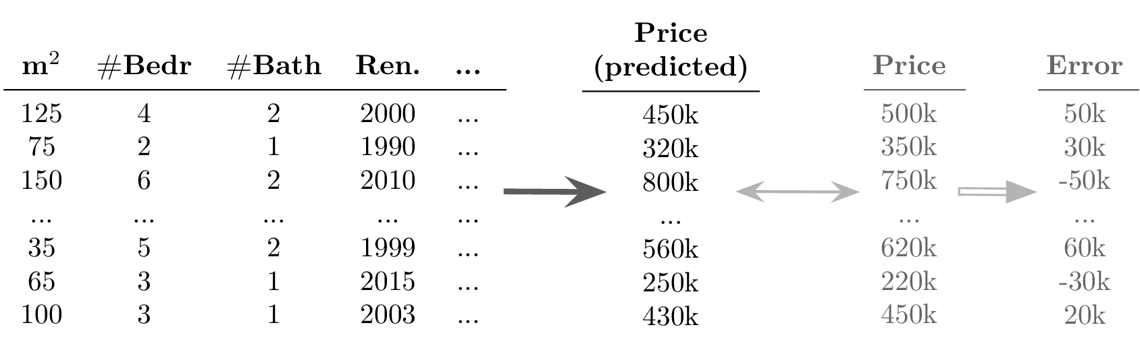
- Example Supervised Learning: Regression
-
Goal: Predict a continuous value for each data point
-
success is uncertain: while it is fairly straightforward to apply the models, it is difficult to determine in advance whether there even exists any relation between the measured inputs and targets (→ beware of garbage in, garbage out!)
-
appropriate definition of the output/target/KPI that should be modeled, i.e., what does it actually mean for a process to run well and how might external factors influence this definition (e.g., can we expect the same performance on an exceptionally hot summer day?)
-
missing important input variables, e.g., if there exist other influencing factors that we haven’t considered or couldn’t measure, which means not all of the target variable’s variance can be explained
-
lots of possibly irrelevant input variables that require careful feature selection to avoid spurious correlations, which would result in incorrect ‘what-if’ forecasts since the true causal relationship between the inputs and outputs isn’t captured
-
often very time intensive data preprocessing necessary, e.g., when combining data from different sources and engineering additional features
Deep Learning & Generative AI
-
automate tedious, repetitive tasks otherwise done by humans, for example (see also ML is everywhere!):
-
text classification (e.g., identify spam / hate speech / fake news; forward customer support request to the appropriate department)
-
sentiment analysis (subtask of text classification: identify if text is positive or negative, e.g., to monitor product reviews or what social media users are saying about your company)
-
speech recognition (e.g., transcribe dictated notes or add subtitles to videos)
-
machine translation (translate texts from one language into another)
-
image classification / object recognition (e.g., identify problematic content (like child pornography) or detect street signs and pedestrians in autonomous driving)
-
image captioning (generate text that describes what’s shown in an image, e.g., to improve the online experience for for people with visual impairment)
-
predictive typing (e.g., suggest possible next words when typing on a smartphone)
-
data generation (e.g., generate new photos/images of specific objects or scenes)
-
style transfer (transform a given image into another style, e.g., make photos look like van Gogh paintings)
-
separate individual sources of an audio signal (e.g., unmix a song, i.e., separate vocals and instruments into individual tracks)
-
-
replace classical simulation models with ML models: since exact simulation models are often slow, the estimation for new samples can be speed up by instead predicting the results with an ML model, for example:
-
AlphaFold: generate 3D protein structure from amino acid sequence (to facilitate drug development)
-
SchNet: predict energy and other properties of molecules given their configuration of atoms (to speed up materials research)
-
-
selecting a suitable neural network architecture & getting it to work properly; especially when replacing traditional simulation models it is often necessary to develop a completely new type of neural network architecture specifically designed for this task and inputs / outputs, which requires a lot of ML & domain knowledge, intuition, and creativity
-
computational resources (don’t train a neural network without a GPU!)
-
data quality and quantity: need a lot of consistently labeled data, i.e., many training instances labeled by human annotators who have to follow the same guidelines (but can be mitigated in some cases by pre-training the network using self-supervised learning)
Information Retrieval
-
improve search results by identifying similar items: given a query, rank results, for example:
-
return matching documents / websites given a search query
-
show similar movies given the movie a user is currently looking at (e.g., same genre, director, etc.)
-
-
quality of results depends heavily on the chosen similarity metric; identifying semantically related items is currently more difficult for some data types (e.g., images) than others (e.g., text)
Recommender Systems
-
personalized suggestions: given a sample from one type of data (e.g., user, protein structure), identify the most relevant samples from another type of data (e.g., movie, drug composition), for example:
-
show a user movies that other users with a similar taste also liked
-
recommend molecule structures that could fit into a protein structure involved in a certain disease
-
-
little / incomplete data, for example, different users might like the same item for different reasons and it is unclear whether, e.g., a user didn’t watch a movie because he’s not interested in it or because he just didn’t notice it yet
Reinforcement Learning
-
Determine an optimal sequence of actions given changing environmental conditions, for example:
-
virtual agent playing a (video) game
-
robot with complex movement patterns, e.g., picking up differently shaped objects from a box
-
⇒ Unlike in regular optimization, where the optimal inputs given a single specific external condition are determined, here an “agent” (= the RL algorithm) tries to learn an optimal sequence of inputs to maximize the cumulative reward received over multiple time steps, where there can be a significant time delay between the inputs and the rewards that they generate (e.g., in a video game we might need to pick up a key in the beginning of a level, but the door that can be opened with it only comes several frames later).
-
usually requires a simulation environment for the agent to learn in before it starts acting in the real world, but developing an accurate simulation model isn’t easy and the agent will exploit any bugs if that results in higher rewards
-
can be tricky to define a clear reward function that should be optimized (imitation learning is often a better option, where the agent instead tries to mimic the decisions made by a human in some situation)
-
difficult to learn correct associations when there are long delays between critical actions and the received rewards
-
agent generates its own data: if it starts off with a bad policy, it will be tricky to escape from this (e.g., in a video game, if the agent always falls down a gap instead of jumping over it, it never sees the rewards that await on the other side and therefore can’t learn that it would be beneficial to jump over the gap)
Other
| ML algorithms are categorized by the output they generate for each input. If you want to solve an ‘input → output’ problem with a different output than the ones listed above, you’ll likely have to settle in for a multi-year research project — if the problem can be solved with ML at all! |